Analytics & OI
Five ranked, real-time screens covering Open Interest activity, price-vs-OI behaviour, F&O concentration, and circuit-hitting stocks - all accessible from a single icon in the right panel.
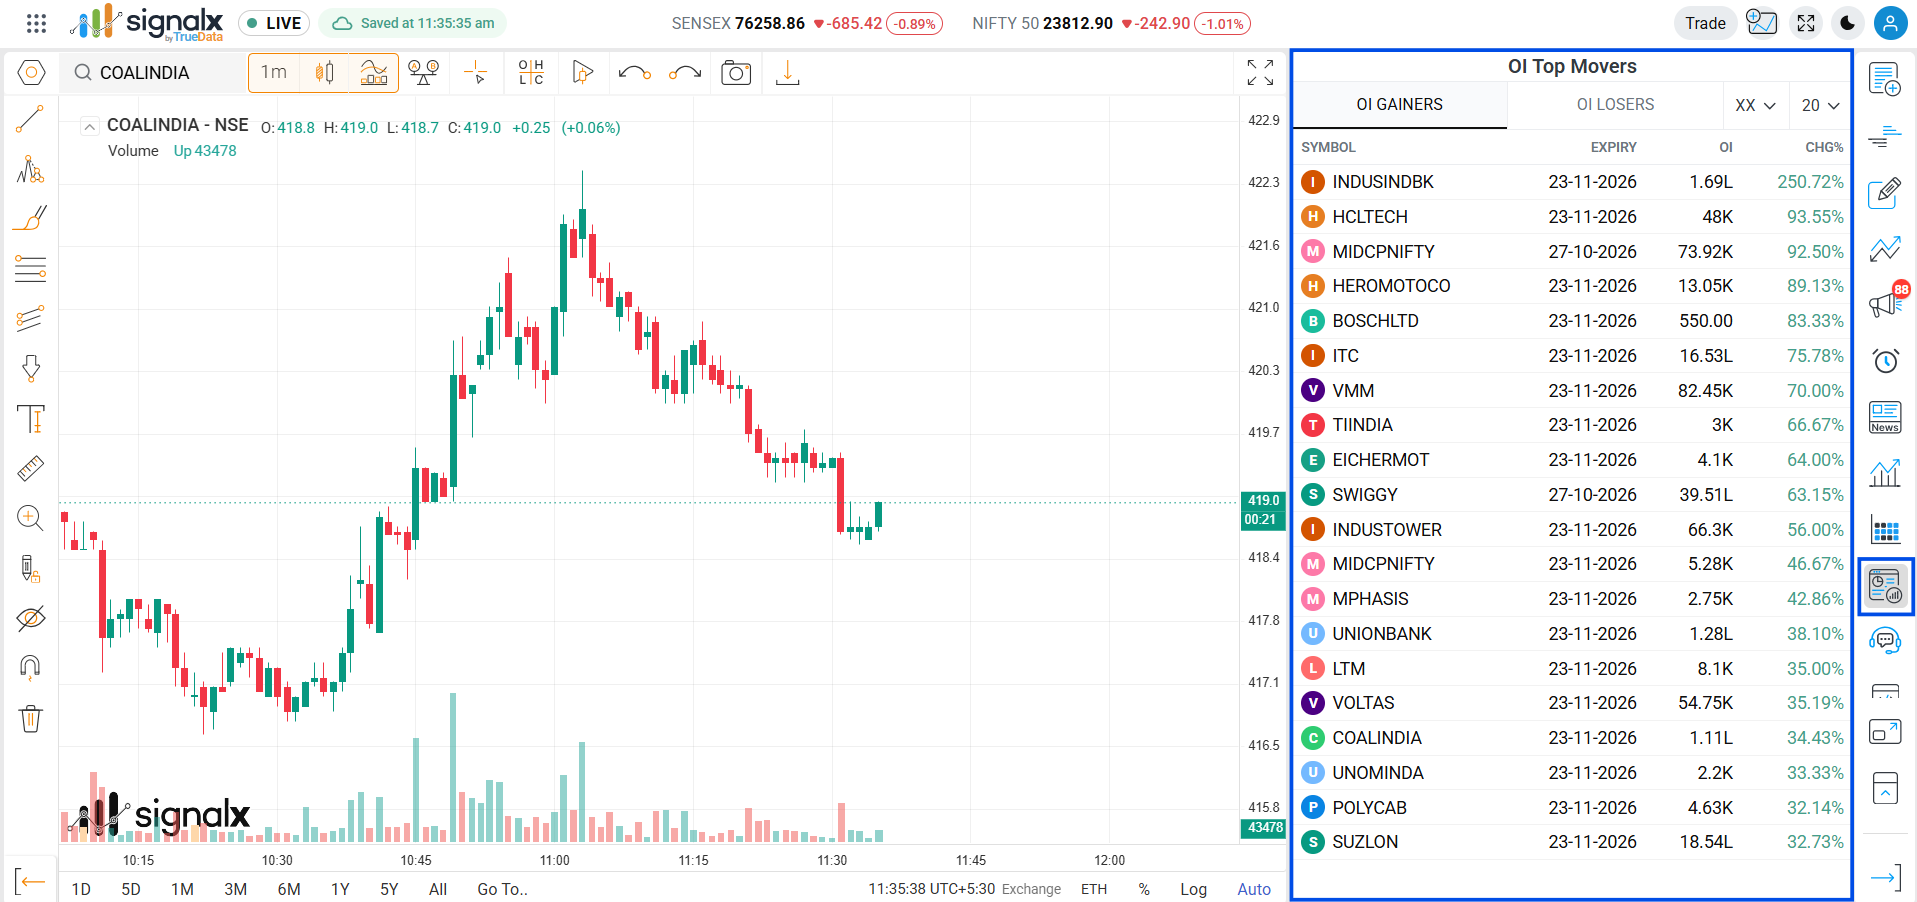
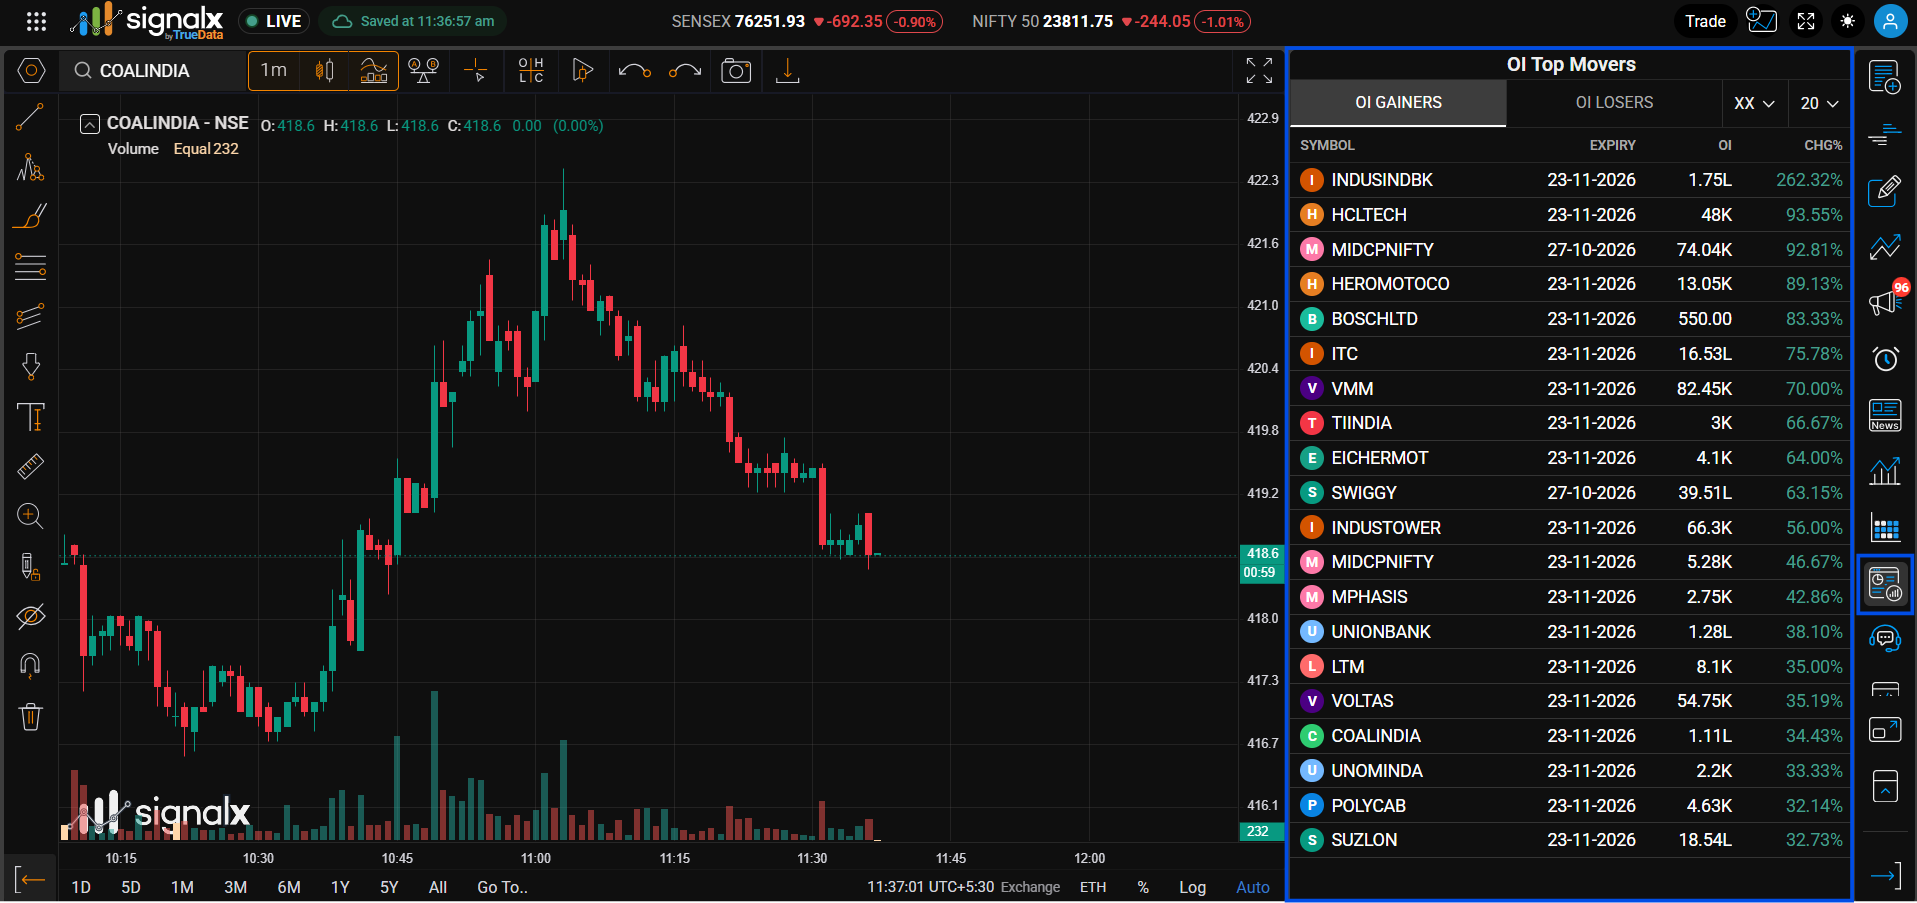
Opening Analytics & OI
Click the Analytics & OI icon in the right-hand toolbar. A menu opens with five screens:
- OI Top Movers - contracts with the sharpest Open Interest change
- OI Gainers Price - securities ranked by price change, alongside their OI
- OI Losers Price - same, for the biggest price fallers
- FO with highest OI - futures and options with the largest OI concentration
- Stocks in Circuit - stocks currently pinned at their upper or lower circuit limit
Selecting any item opens that screen as a ranked table. Every screen shares the same three controls, described below, so once you know one you know them all.
OI Top Movers
Tabs: OI Gainers · OI Losers
Ranks contracts by the percentage change in Open Interest itself, independent of price direction. Use this to spot where fresh positions are being built or unwound fastest, across stocks, futures, and options in one list. Columns: Symbol, Expiry, OI, Chg%.
A large jump in OI Gainers without a matching price move often precedes a breakout - positions are building before the market has fully reacted.
OI Gainers Price
Tabs: Price Gainers · Price Losers
Ranks securities by price change while showing their current OI alongside, letting you cross-check whether a price move is backed by real position build-up. Columns: Symbol, Expiry, OI, Chg%.
OI Losers Price
Tabs: Price Gainers · Price Losers
The counterpart list, focused on securities where OI is falling. Pair this with OI Gainers Price to separate genuine trend moves from short covering or long unwinding - see the interpretation guide below. Columns: Symbol, Expiry, OI, Chg%.
FO Highest OI
Tabs: Futures Highest OI · Options Highest OI
Ranks contracts by absolute Open Interest rather than change, surfacing where the heaviest positioning already sits. Strikes and futures with the largest OI concentration often act as support/resistance zones into expiry. Columns: Symbol, Expiry, OI, Chg%.
Stocks in Circuit
Tabs: Upper Circuit · Lower Circuit
Lists cash-market stocks currently locked at their exchange-defined circuit limit (typically 5%, 10%, or 20%, depending on the stock's circuit band). Upper Circuit shows stocks pinned at their maximum daily gain; Lower Circuit shows those pinned at their maximum daily loss. Columns: Symbol, LTP, Chg% - no Expiry or OI columns, since these are equity, not derivative, listings. The instrument filter here selects NSE or BSE instead of CE/PE.
Reading Price & OI Together
The four combinations that explain what's really happening behind a price move