Chart Types
SignalX provides professional-grade chart visualisation powered by TrueData's real-time tick engine with multiple chart styles for every trading workflow.
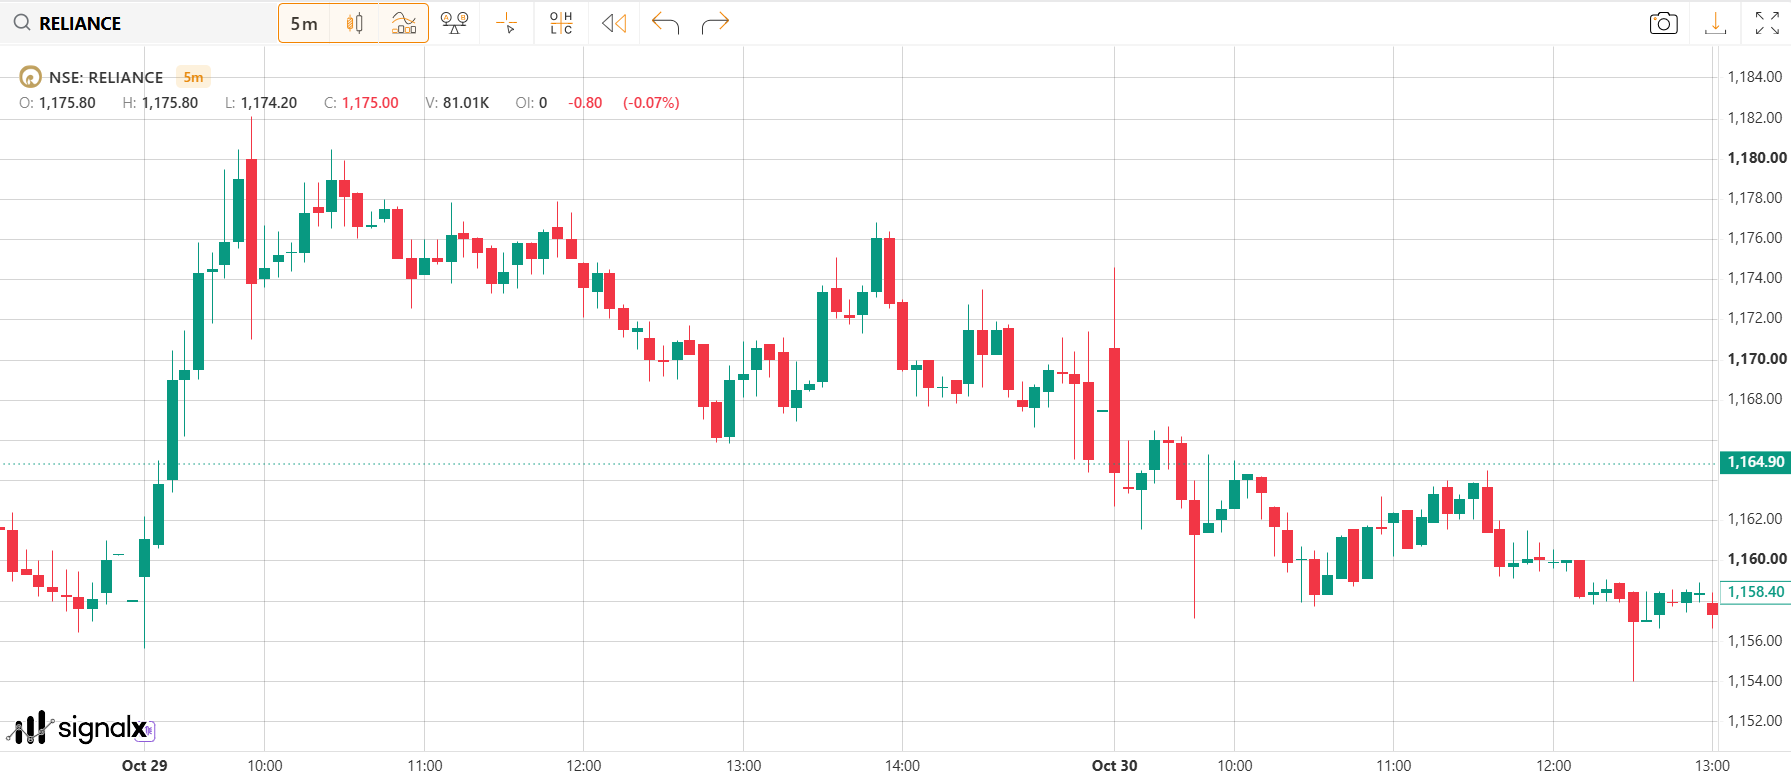
Candlestick
Displays Open, High, Low and Close prices using candle bodies and wicks for each timeframe.
Common usage
Widely used for technical analysis, candlestick patterns and price action trading.
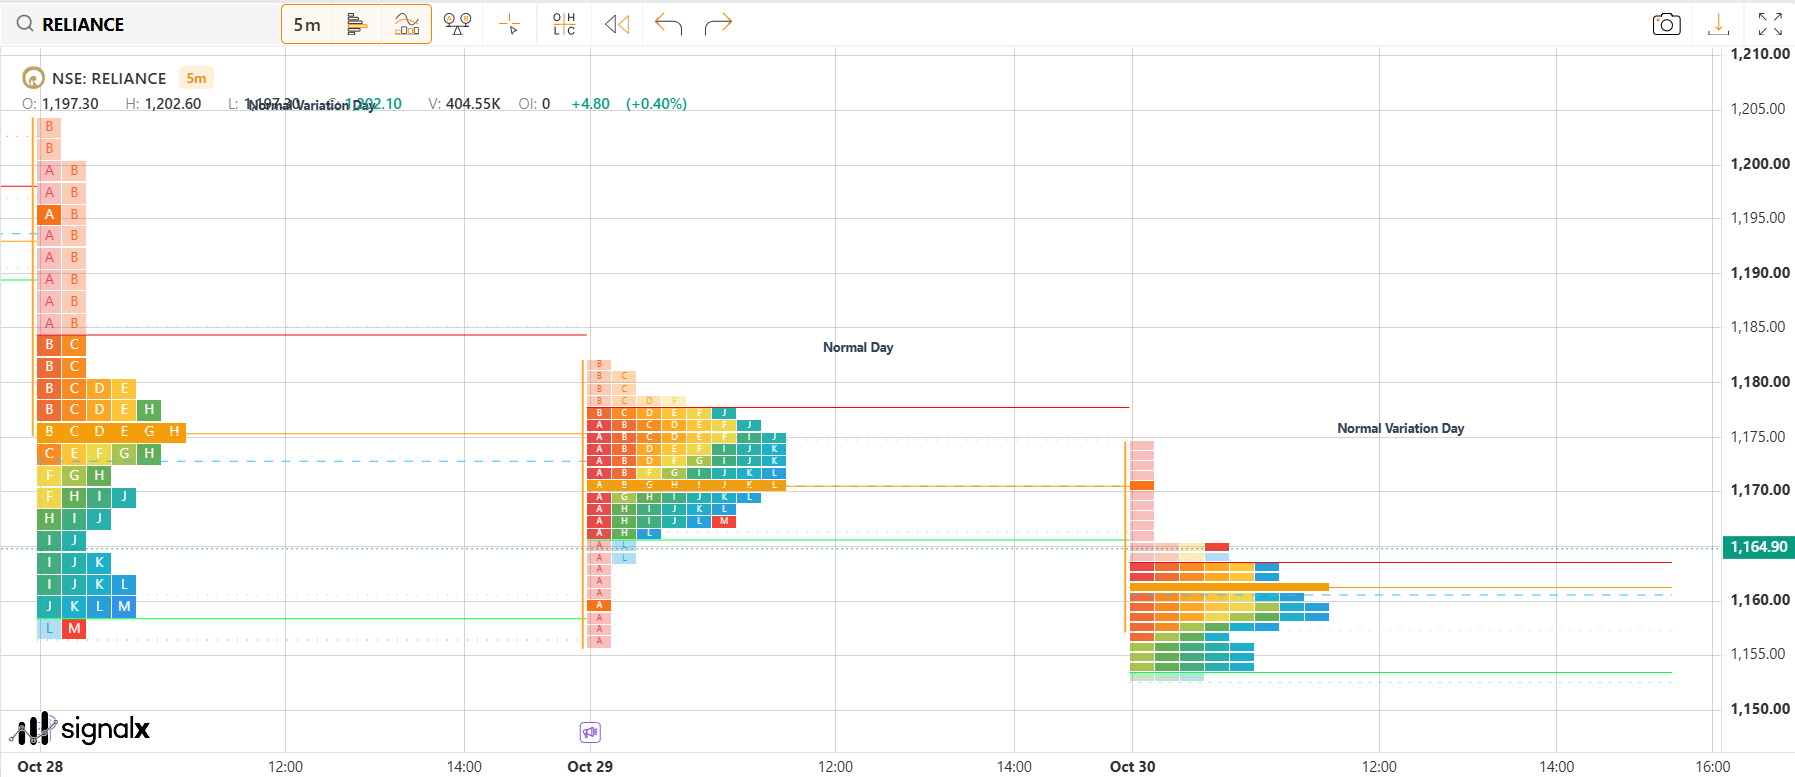
TPO (Market Profile)
Time Price Opportunity chart that stacks letter blocks for each time period at every price level, revealing where price spent the most time during a session.
Common usage
Ideal for identifying value area, Point of Control, initial balance and day types such as Trend, Normal and Neutral days.
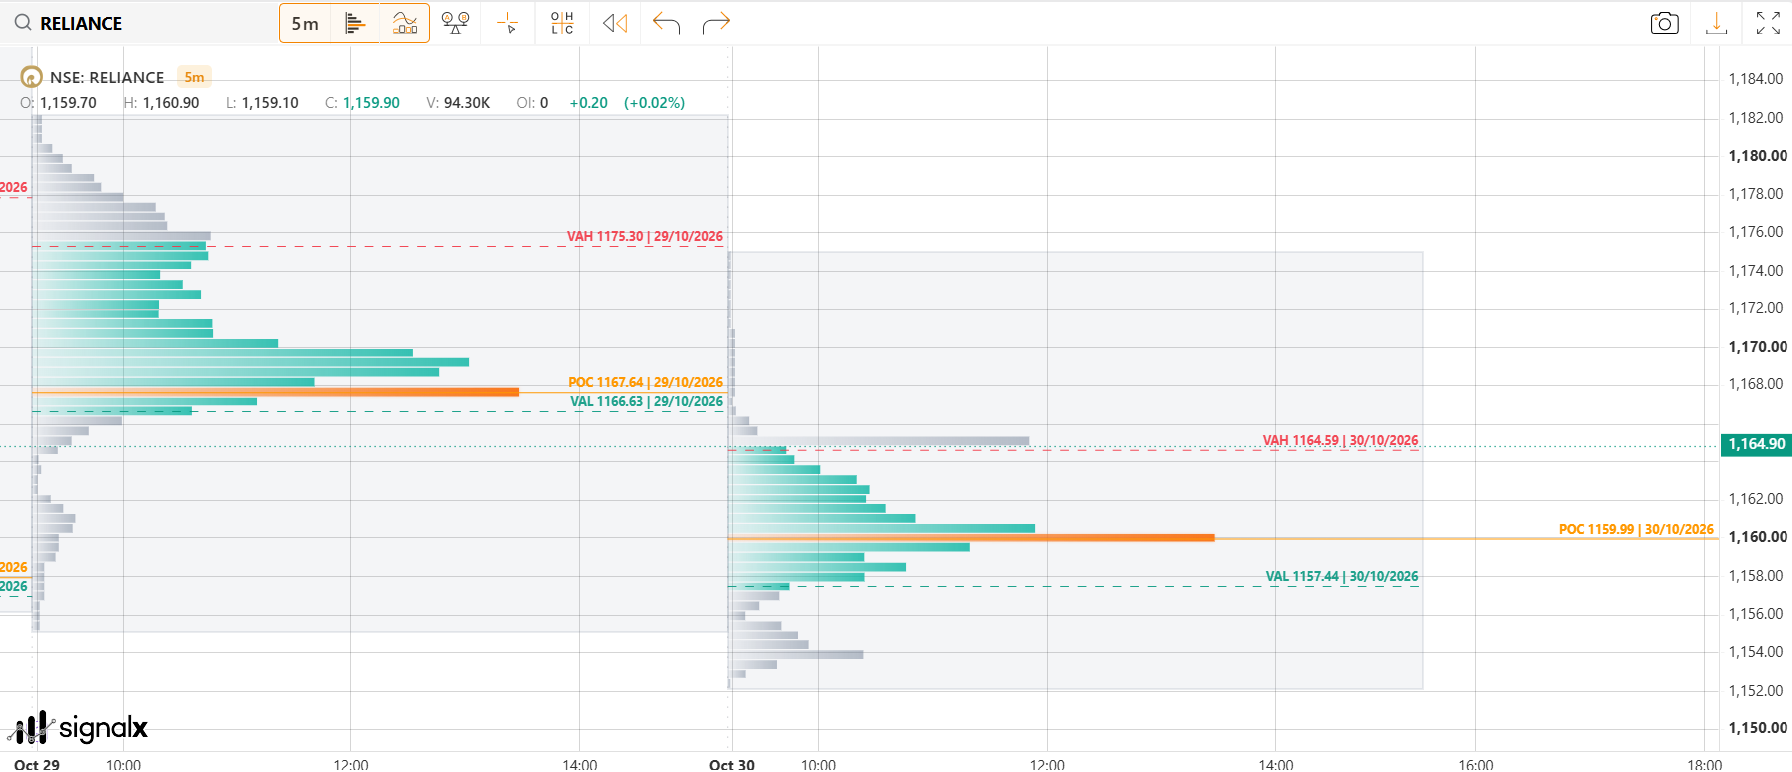
Volume Profile
Horizontal histogram showing traded volume at each price level, with Point of Control (POC), Value Area High (VAH) and Value Area Low (VAL) marked for every session.
Common usage
Best for spotting high and low volume nodes, fair value zones and key support/resistance levels.
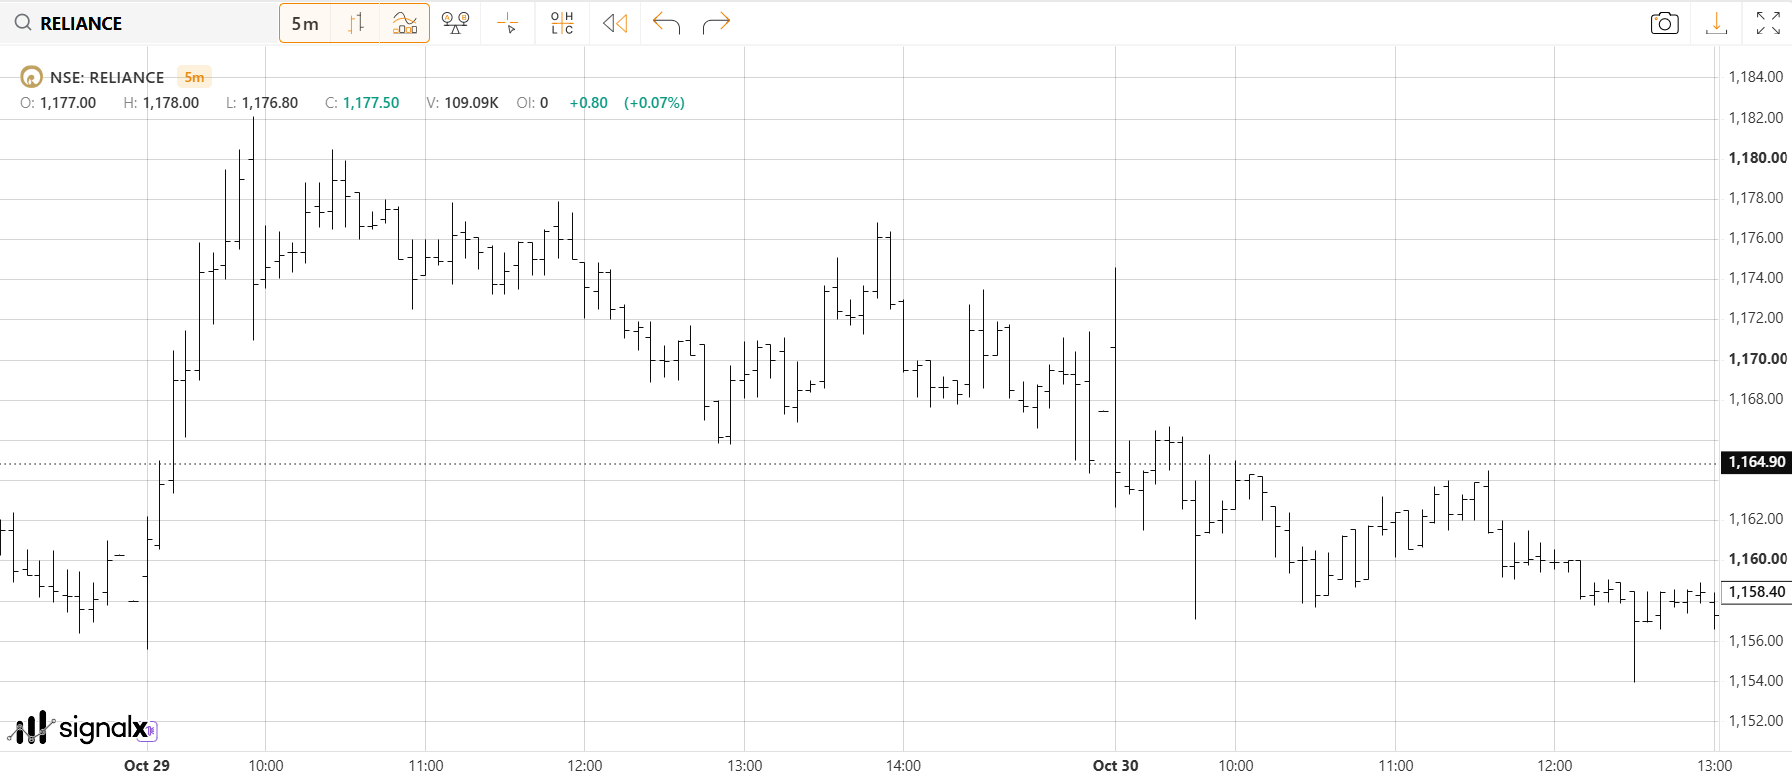
Bars
Traditional OHLC chart displaying Open, High, Low and Close values for each interval using vertical bars.
Common usage
Preferred by professional traders who want detailed price structure with minimal visual clutter.
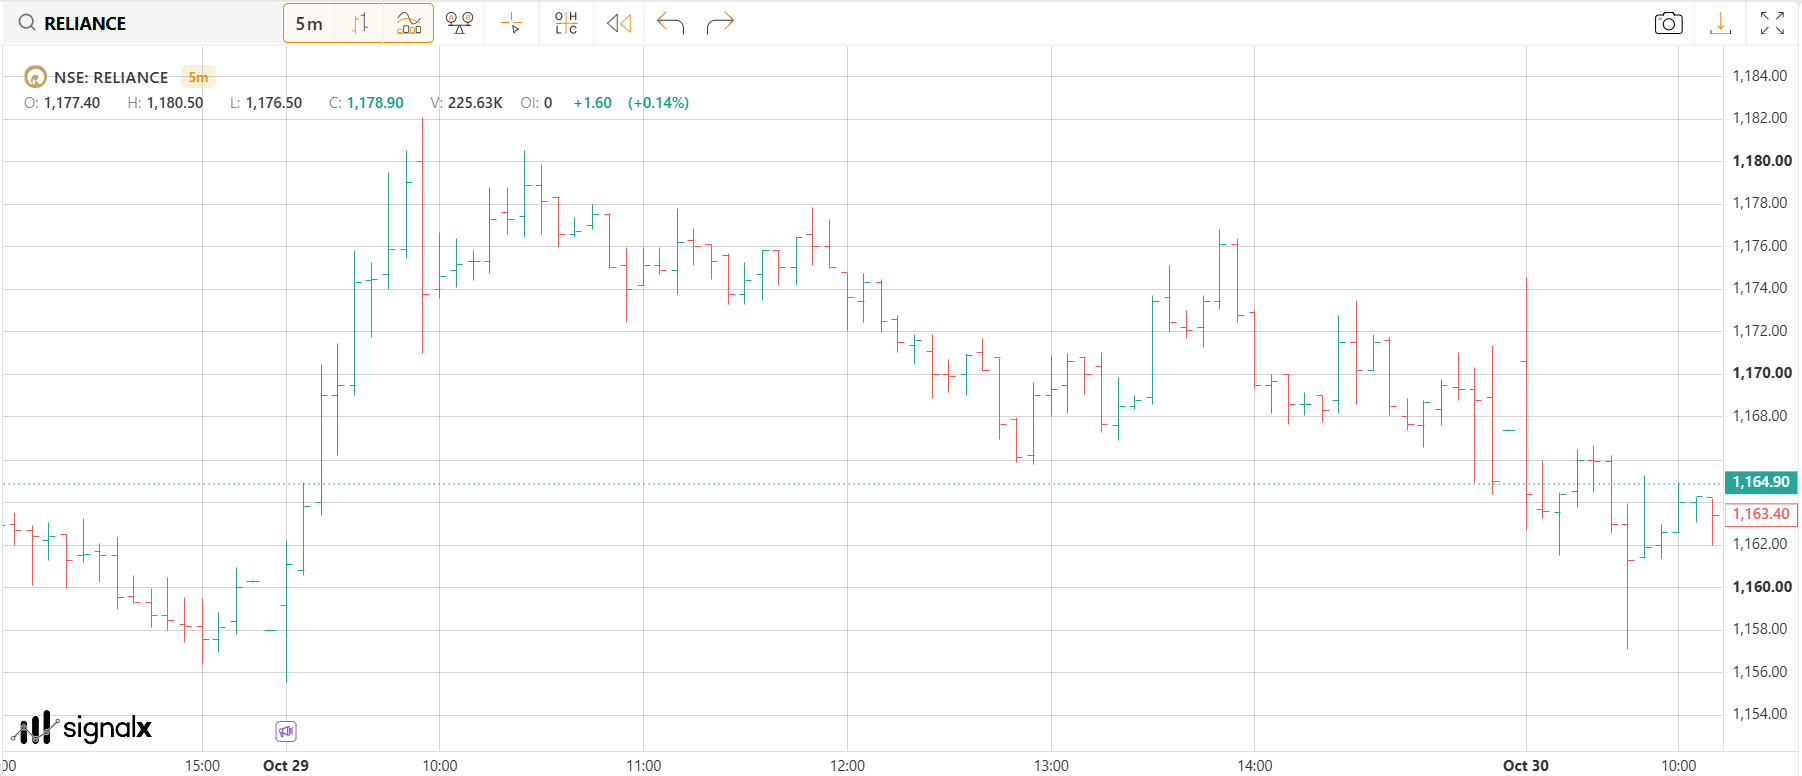
Colored Bars
OHLC bars with bullish and bearish color distinction for faster visual trend recognition.
Common usage
Useful for quickly identifying momentum shifts and directional bias.
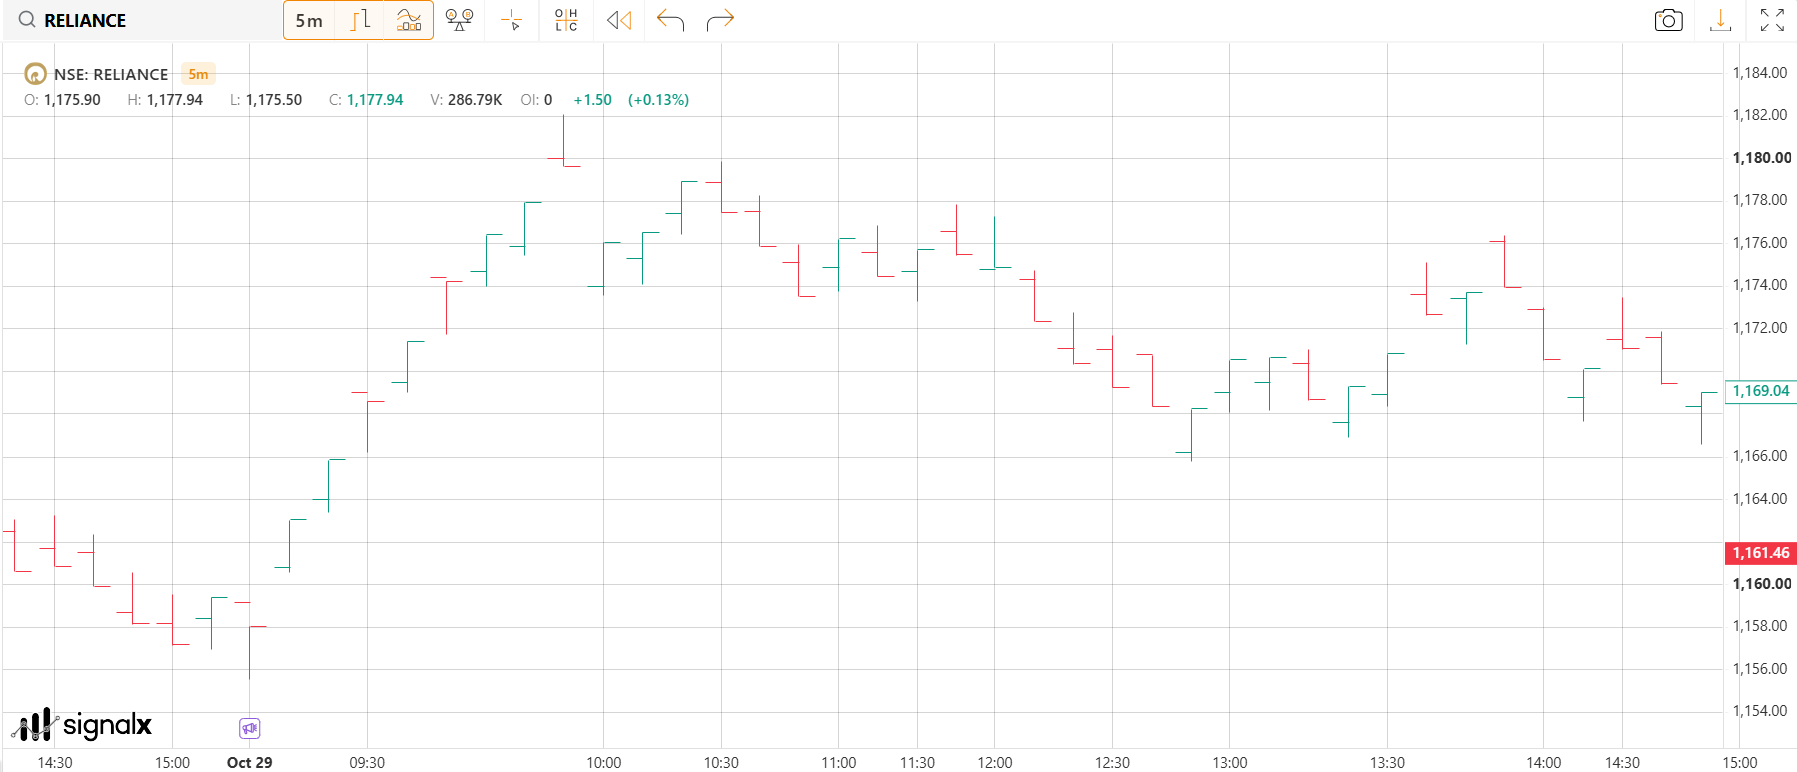
Range Bars
Price-based bars that print only when the market moves by a predefined range, independent of time.
Common usage
Best for high-volatility trading and filtering sideways market noise.
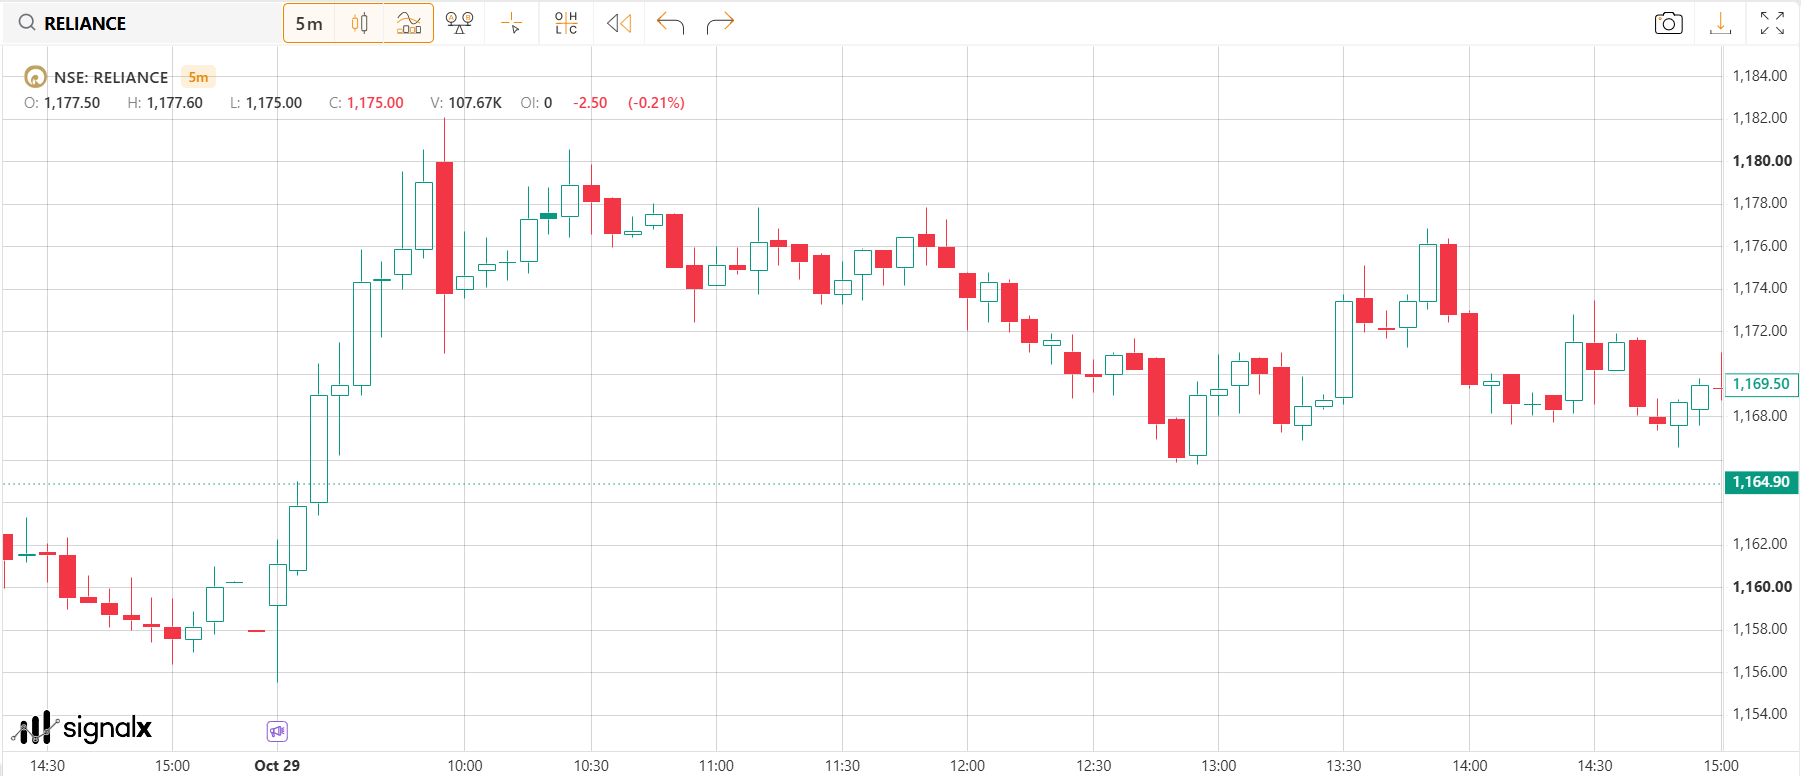
Hollow Candles
Candlestick variation where hollow and filled bodies represent additional directional information.
Common usage
Helpful for identifying continuation strength and market sentiment shifts.
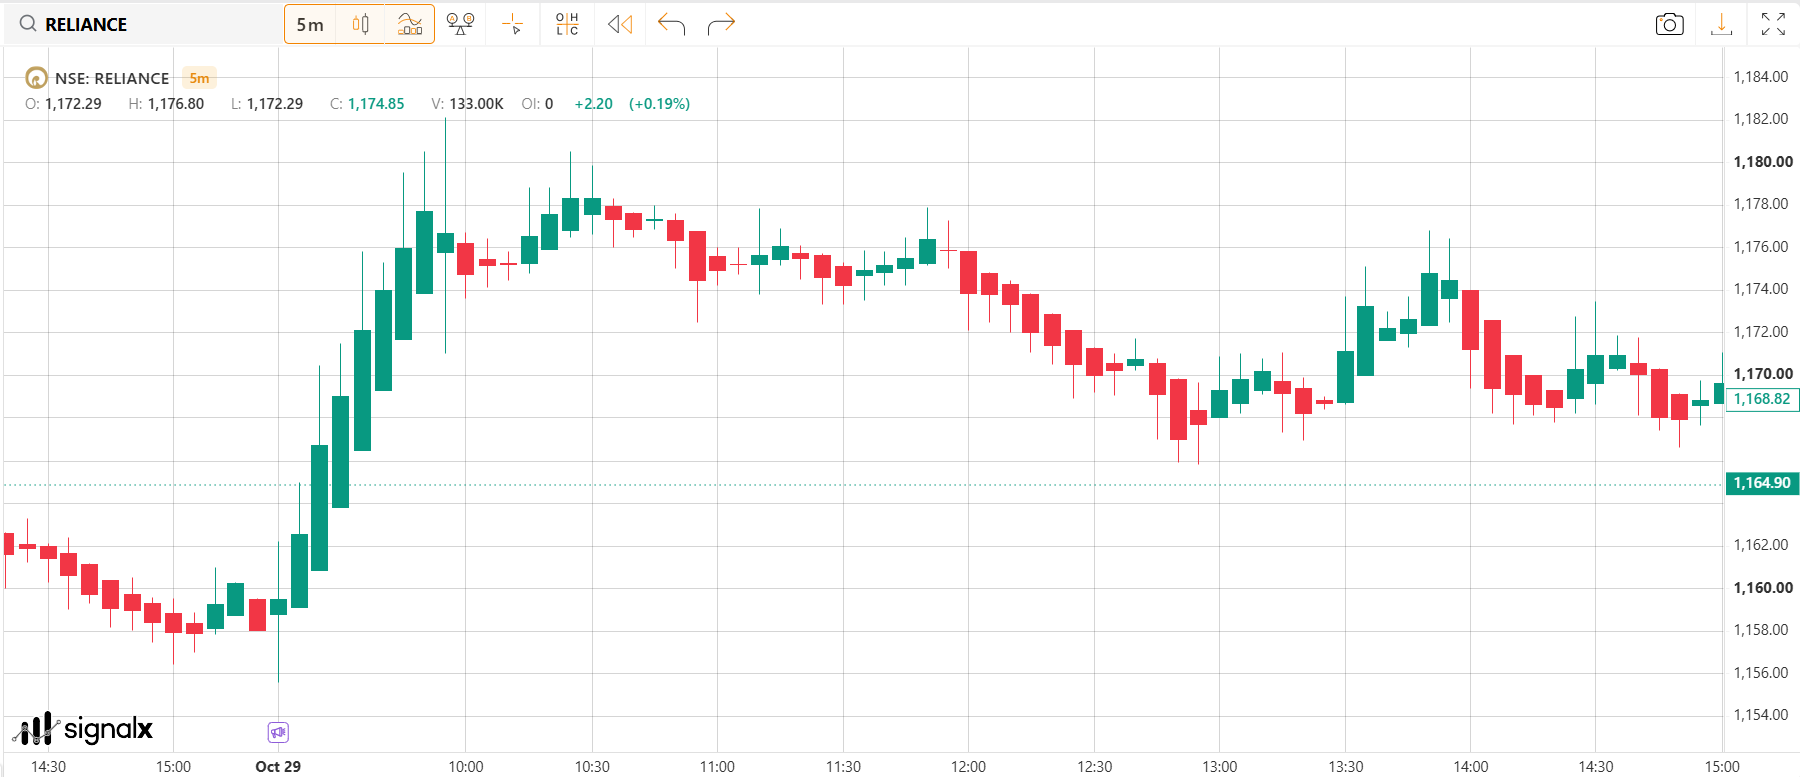
Heikin Ashi
A modified candlestick calculation that averages price movement to smooth chart noise.
Common usage
Best for identifying sustained trends and reducing false reversal signals.
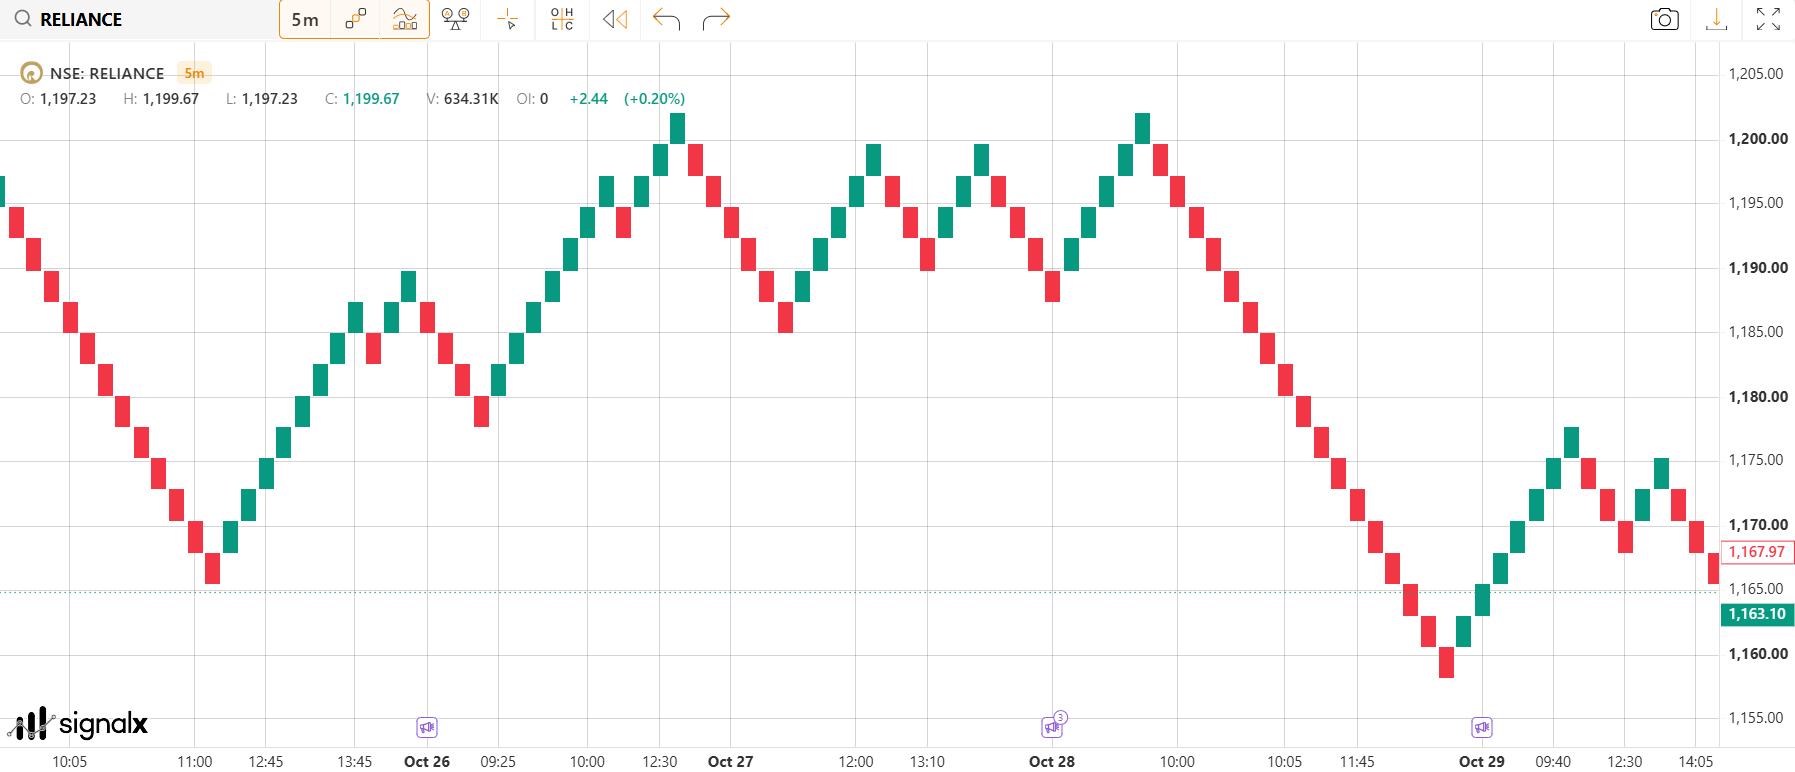
Renko
Brick-based chart that ignores time and focuses only on fixed price movement.
Common usage
Excellent for trend-following strategies and filtering small price fluctuations.
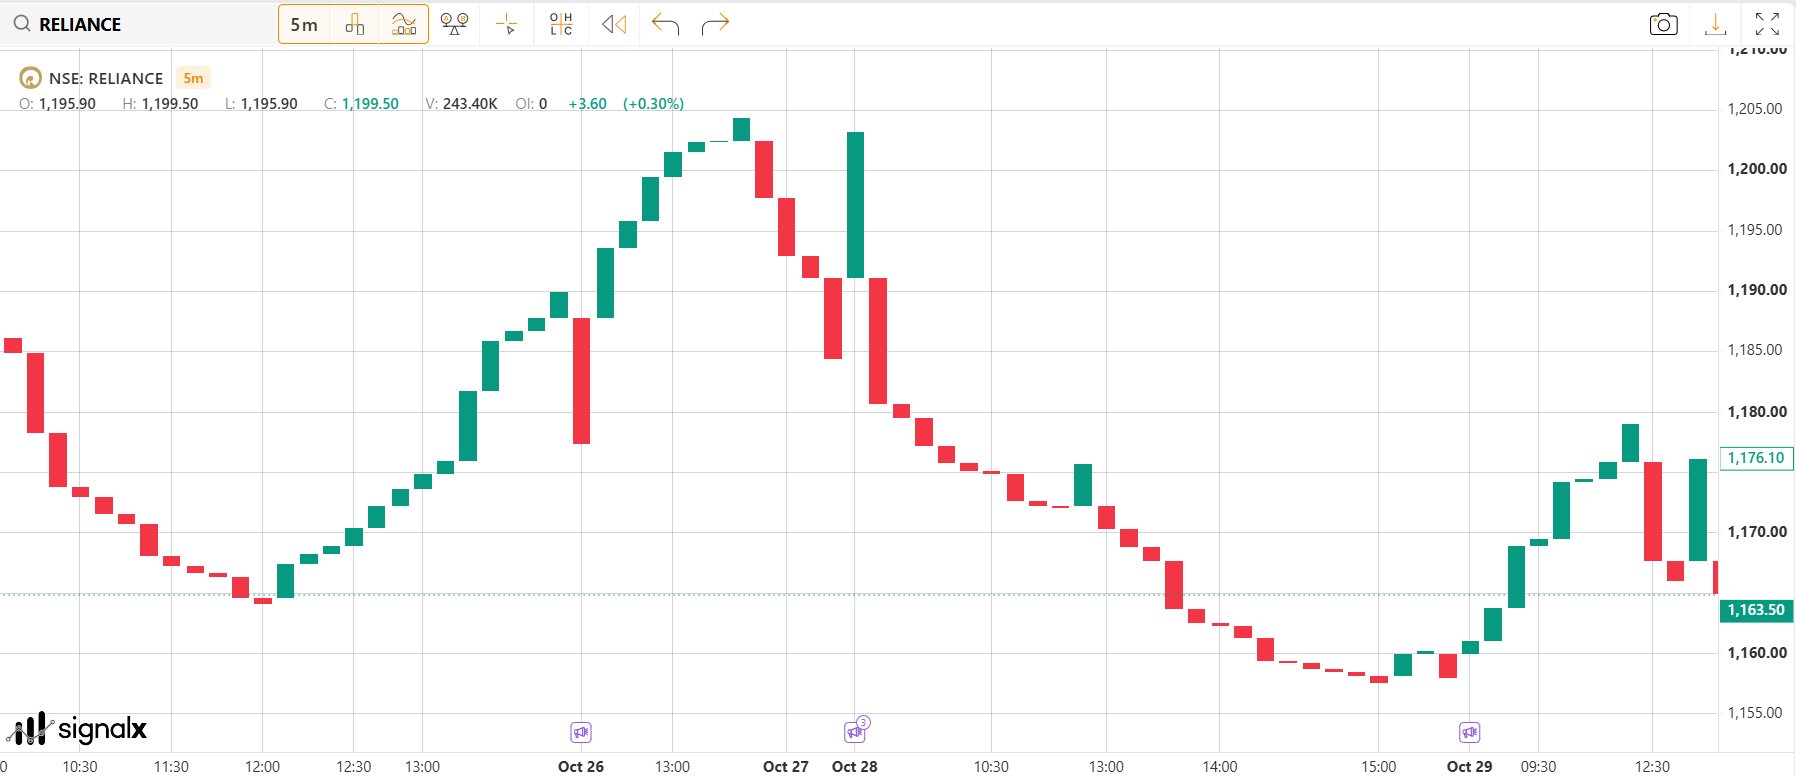
Line Break
Breakout-focused chart that creates new lines only when previous highs or lows are exceeded.
Common usage
Useful for spotting reversals, breakouts and trend continuation.
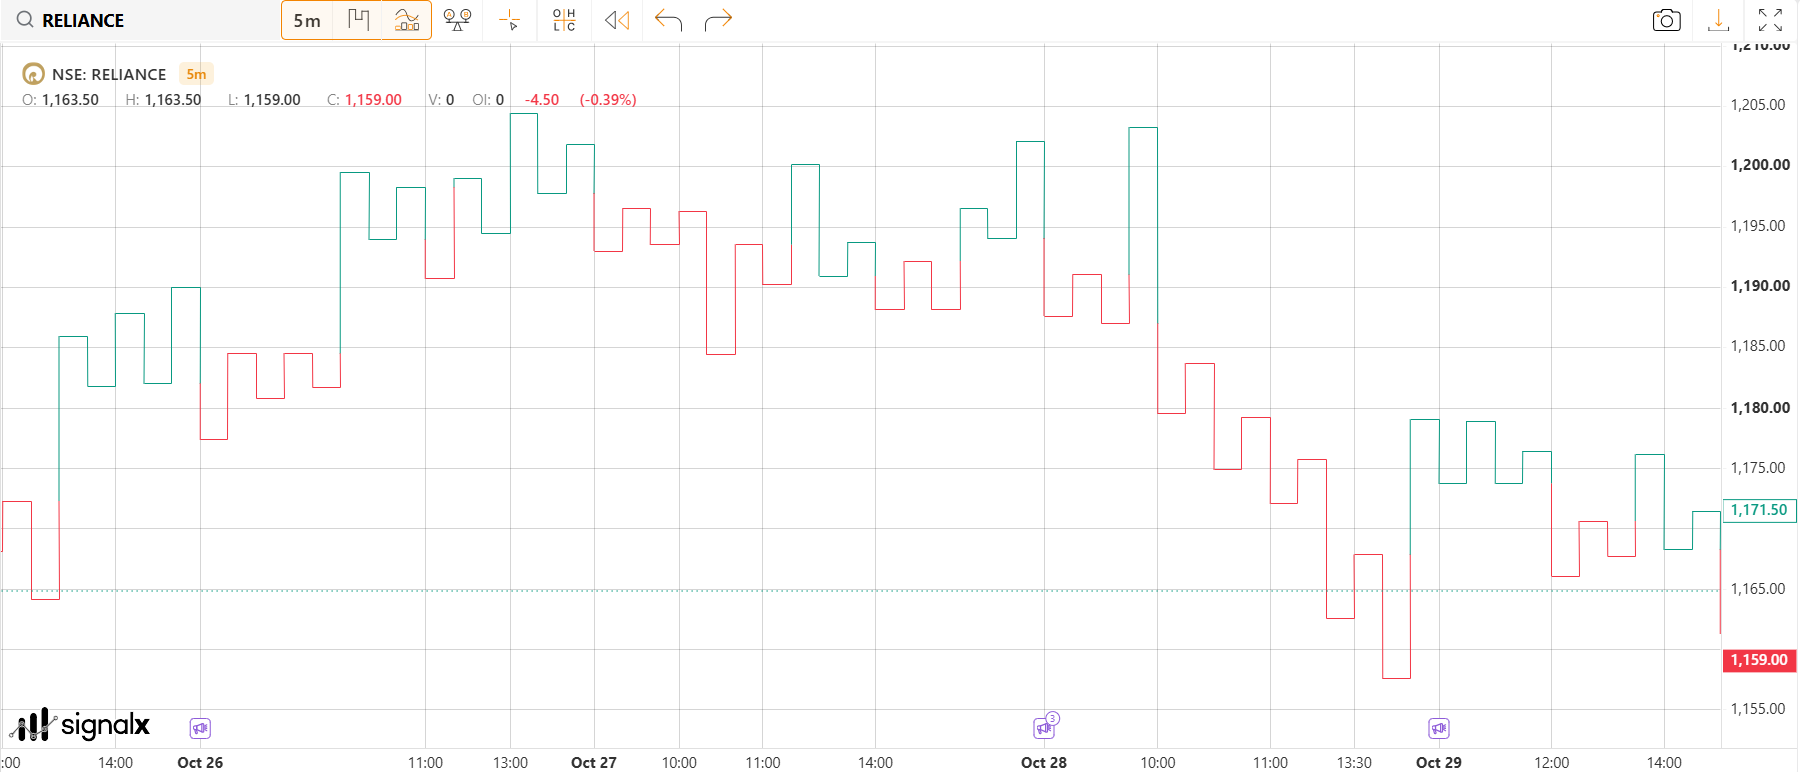
Kagi
Japanese trend chart that changes direction only after a predefined reversal amount.
Common usage
Best for analysing supply-demand shifts and trend strength.
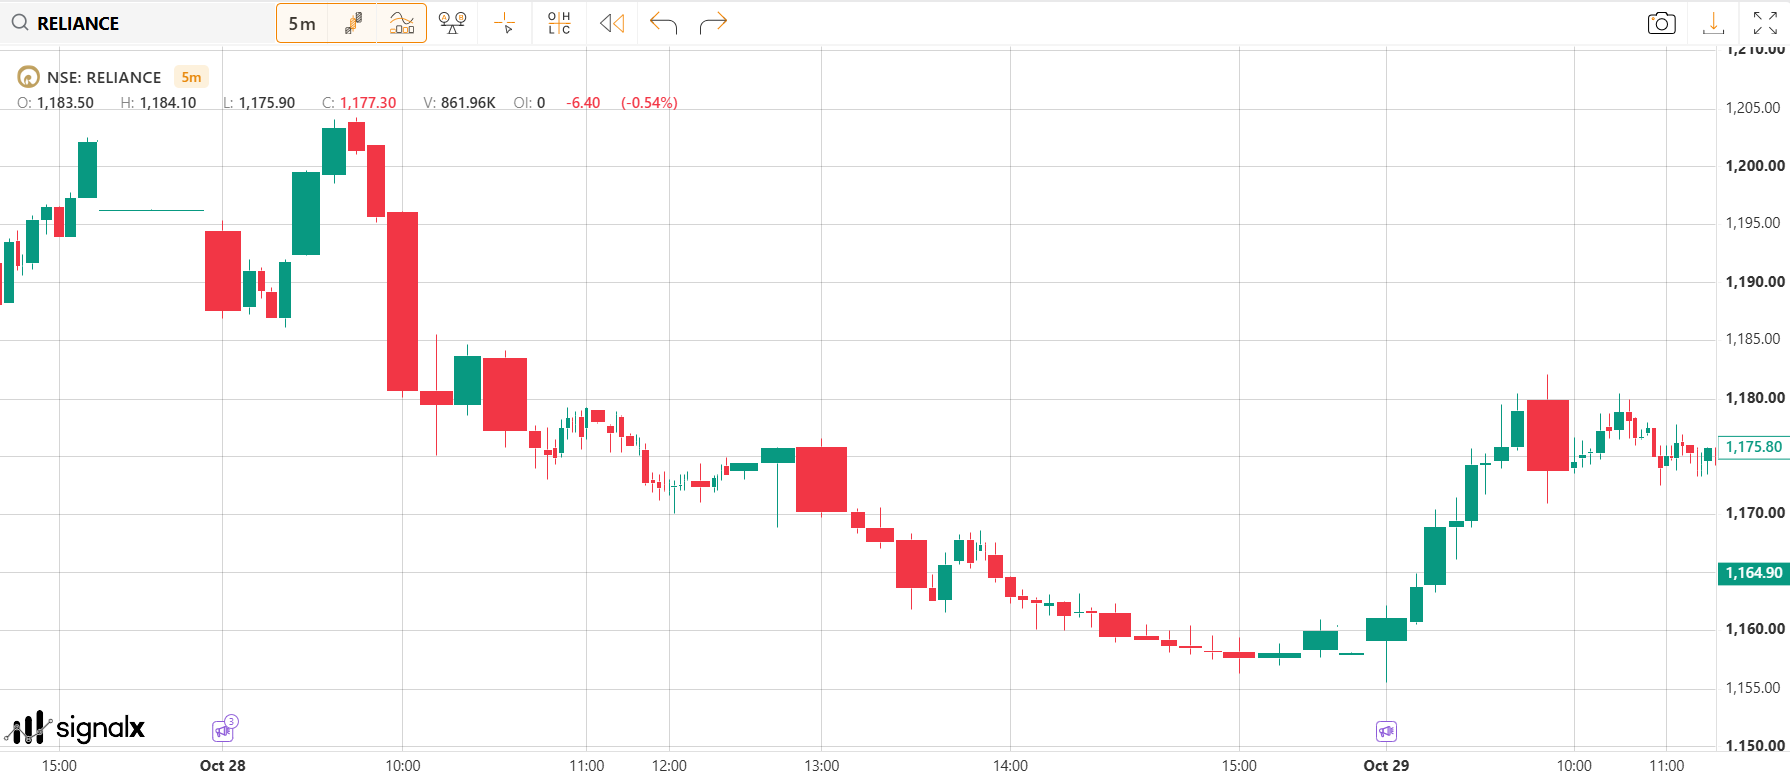
Candles Volume
Candlestick chart enhanced with volume representation for each candle.
Common usage
Useful for analysing price movement together with market participation.
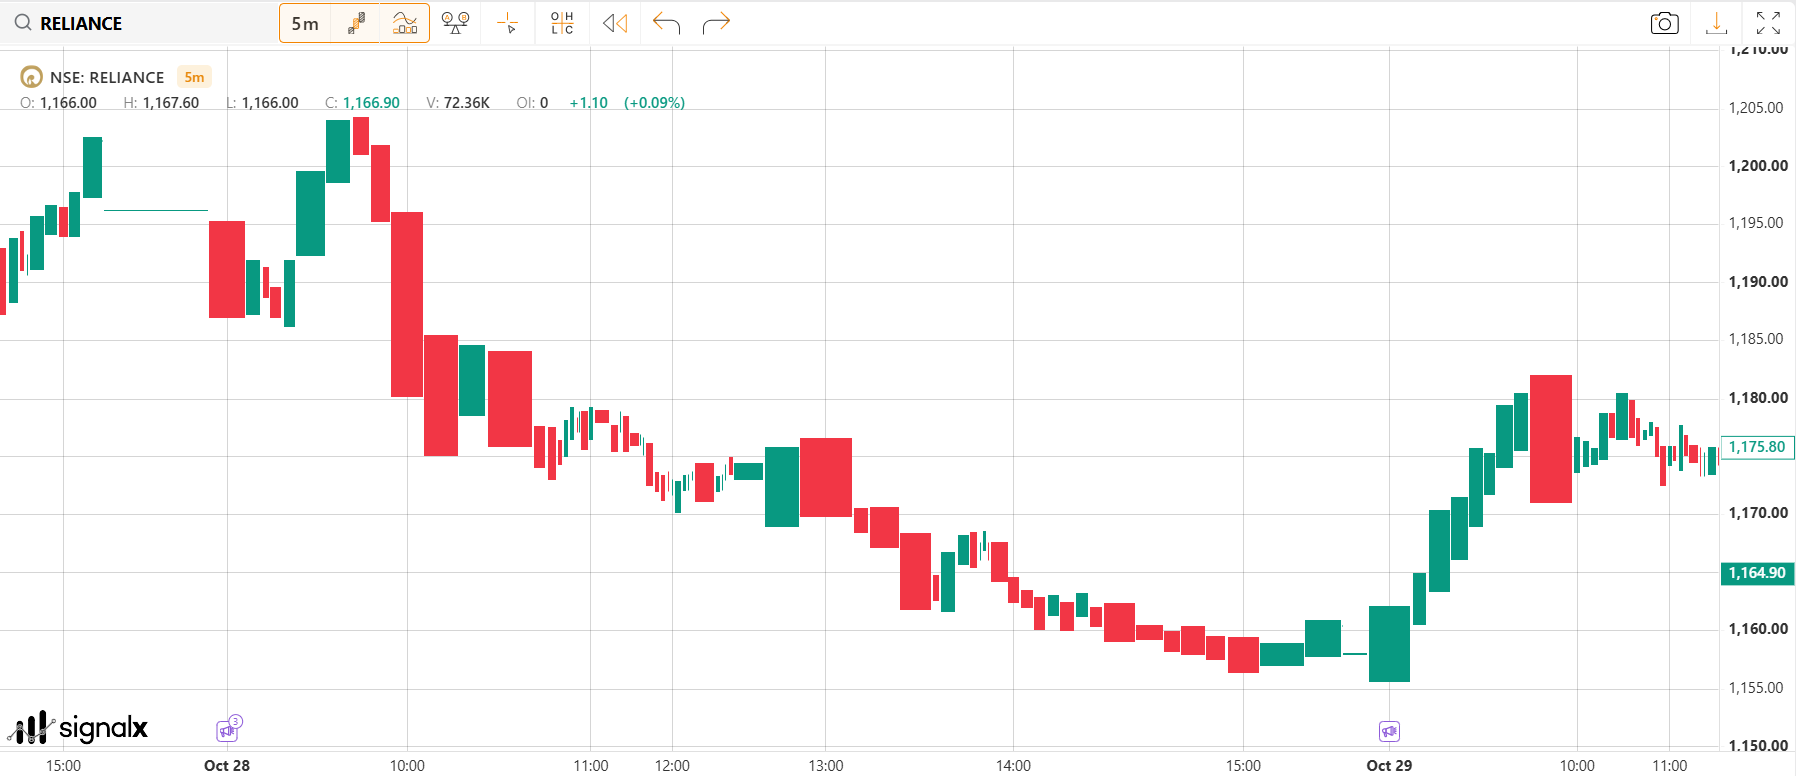
Equi Volume
Chart where candle width expands and contracts based on traded volume.
Common usage
Helps traders understand how volume impacts price movement.
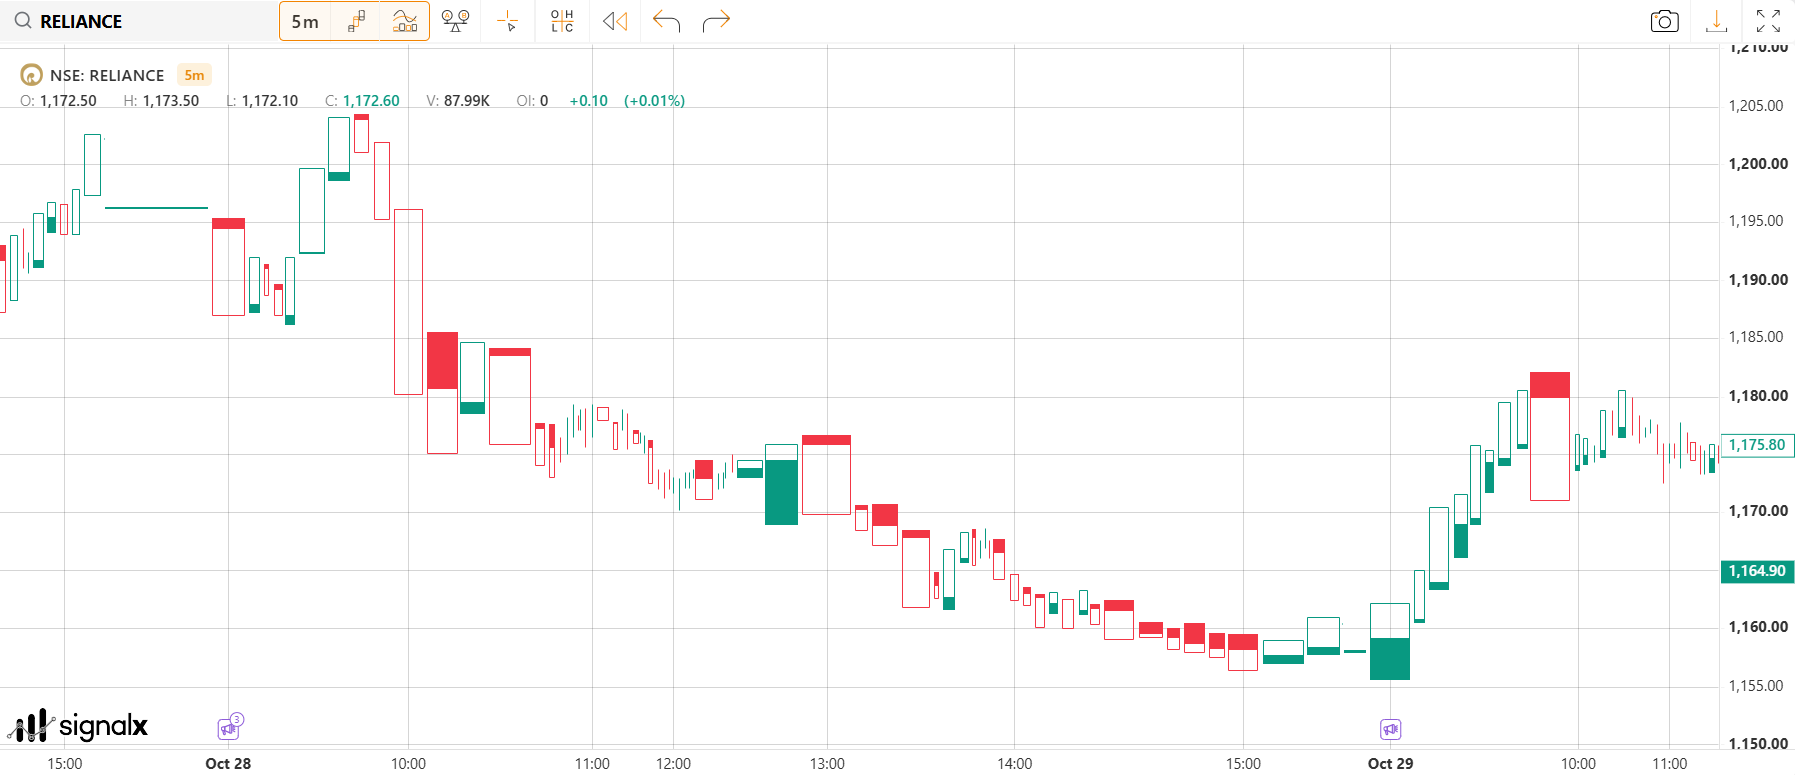
Equi Volume Shadow
Enhanced Equi Volume chart including shadow/wick representation for full price range visibility.
Common usage
Provides deeper analysis of intraday volatility alongside volume.
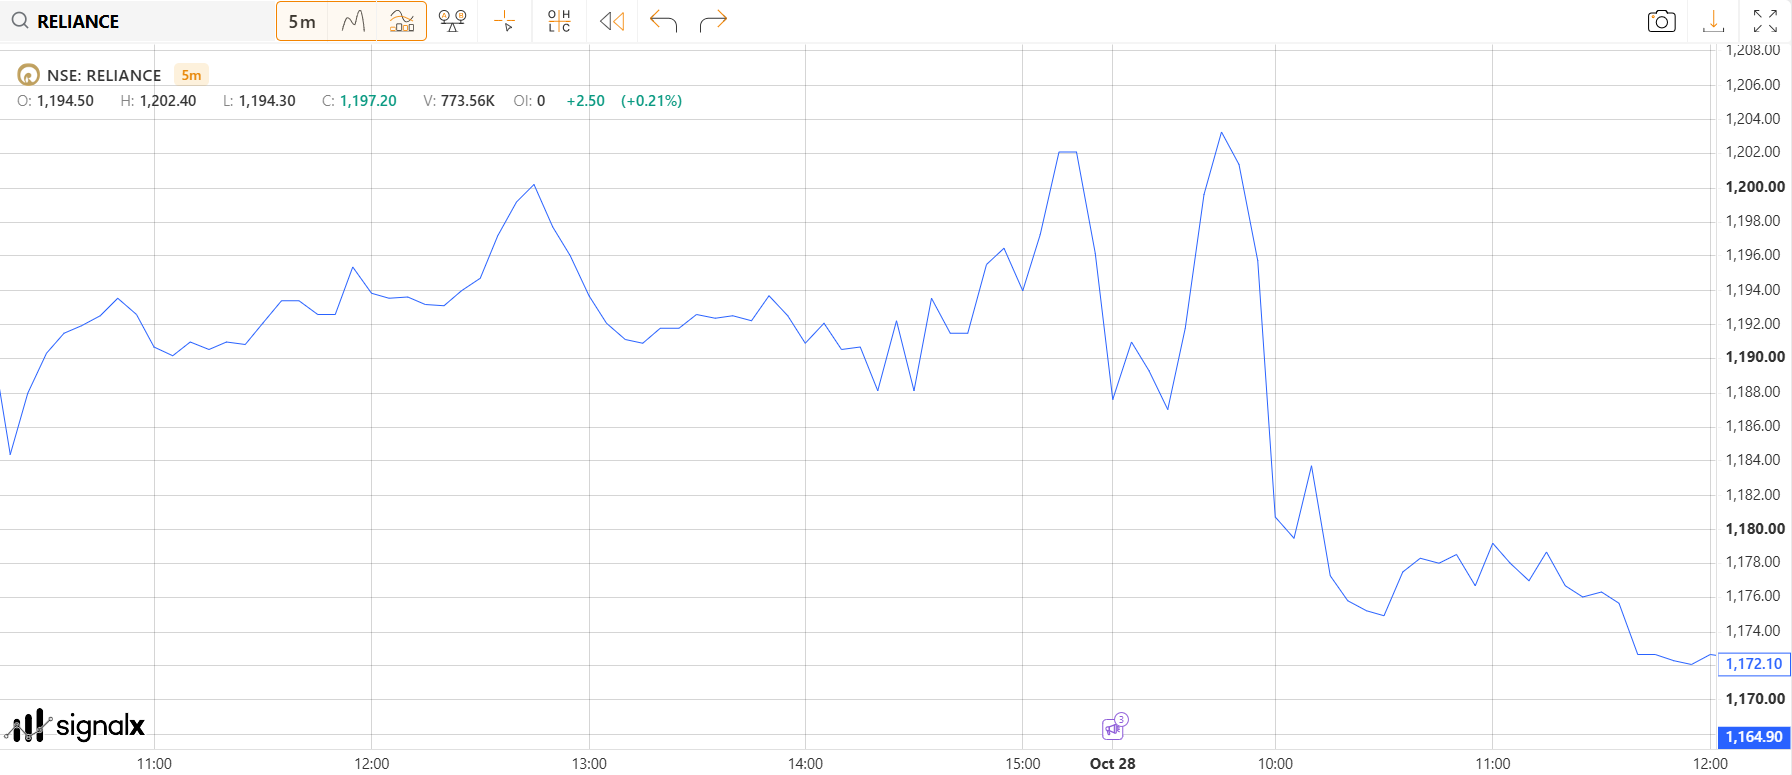
Line
Simple chart connecting closing prices with a continuous line.
Common usage
Best for long-term trend analysis and clean market overview.
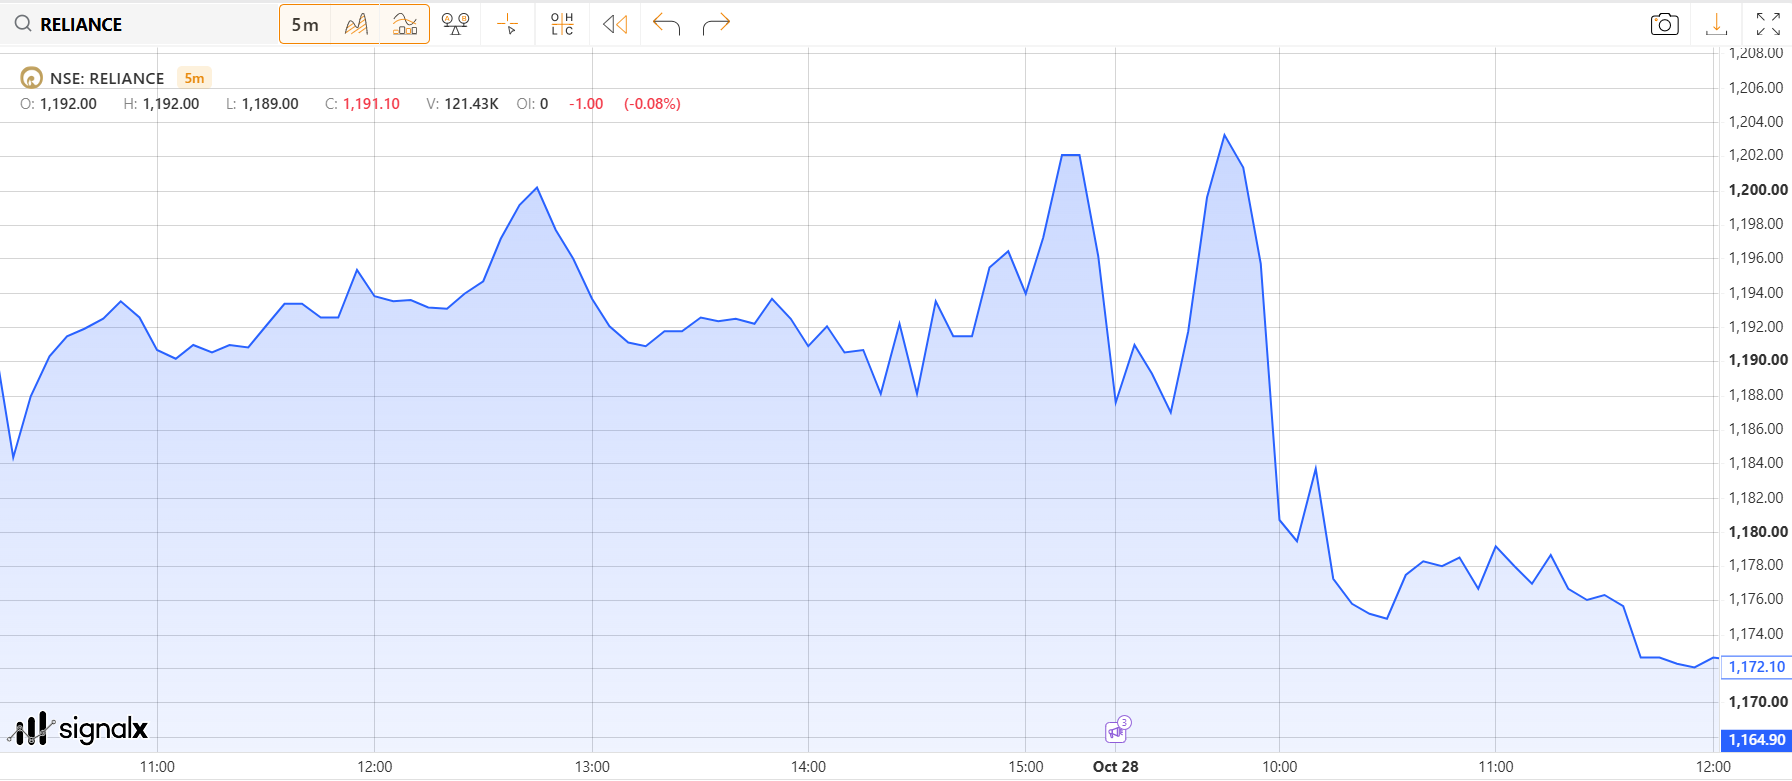
Area
Line chart with the area beneath the line filled for enhanced visual trend clarity.
Common usage
Useful for portfolio tracking and long-term performance visualisation.
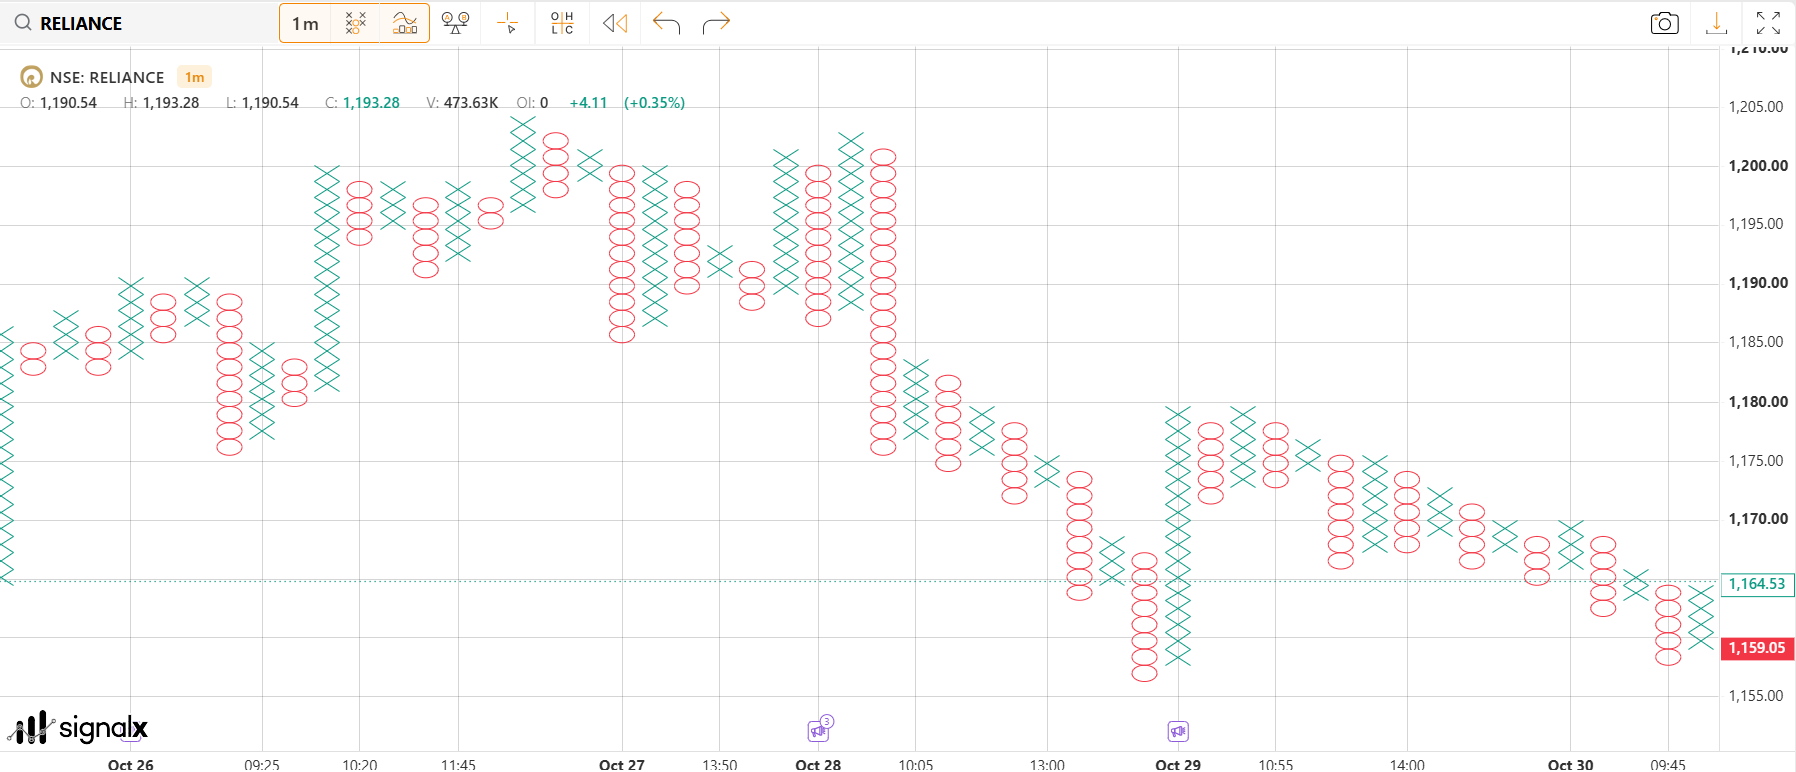
Point & Figure
Price-only chart using X and O columns while ignoring time-based movement.
Common usage
Popular for identifying breakout zones, support/resistance and long-term trends.