Option Chain
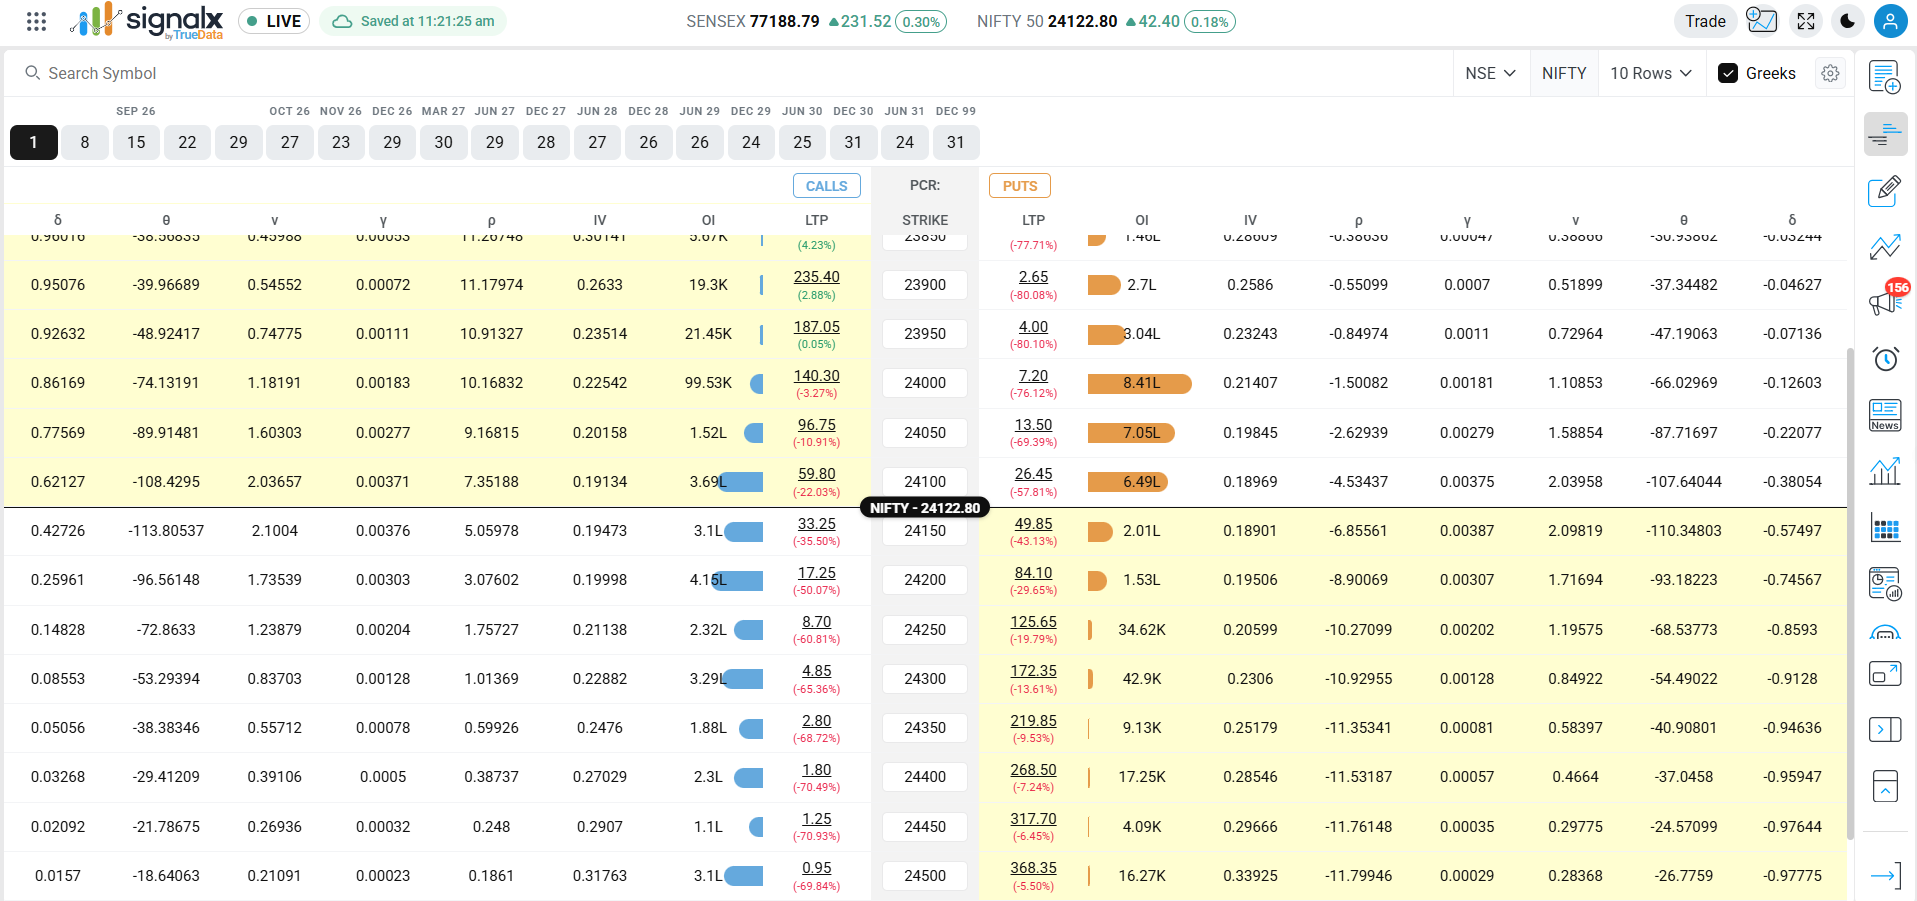
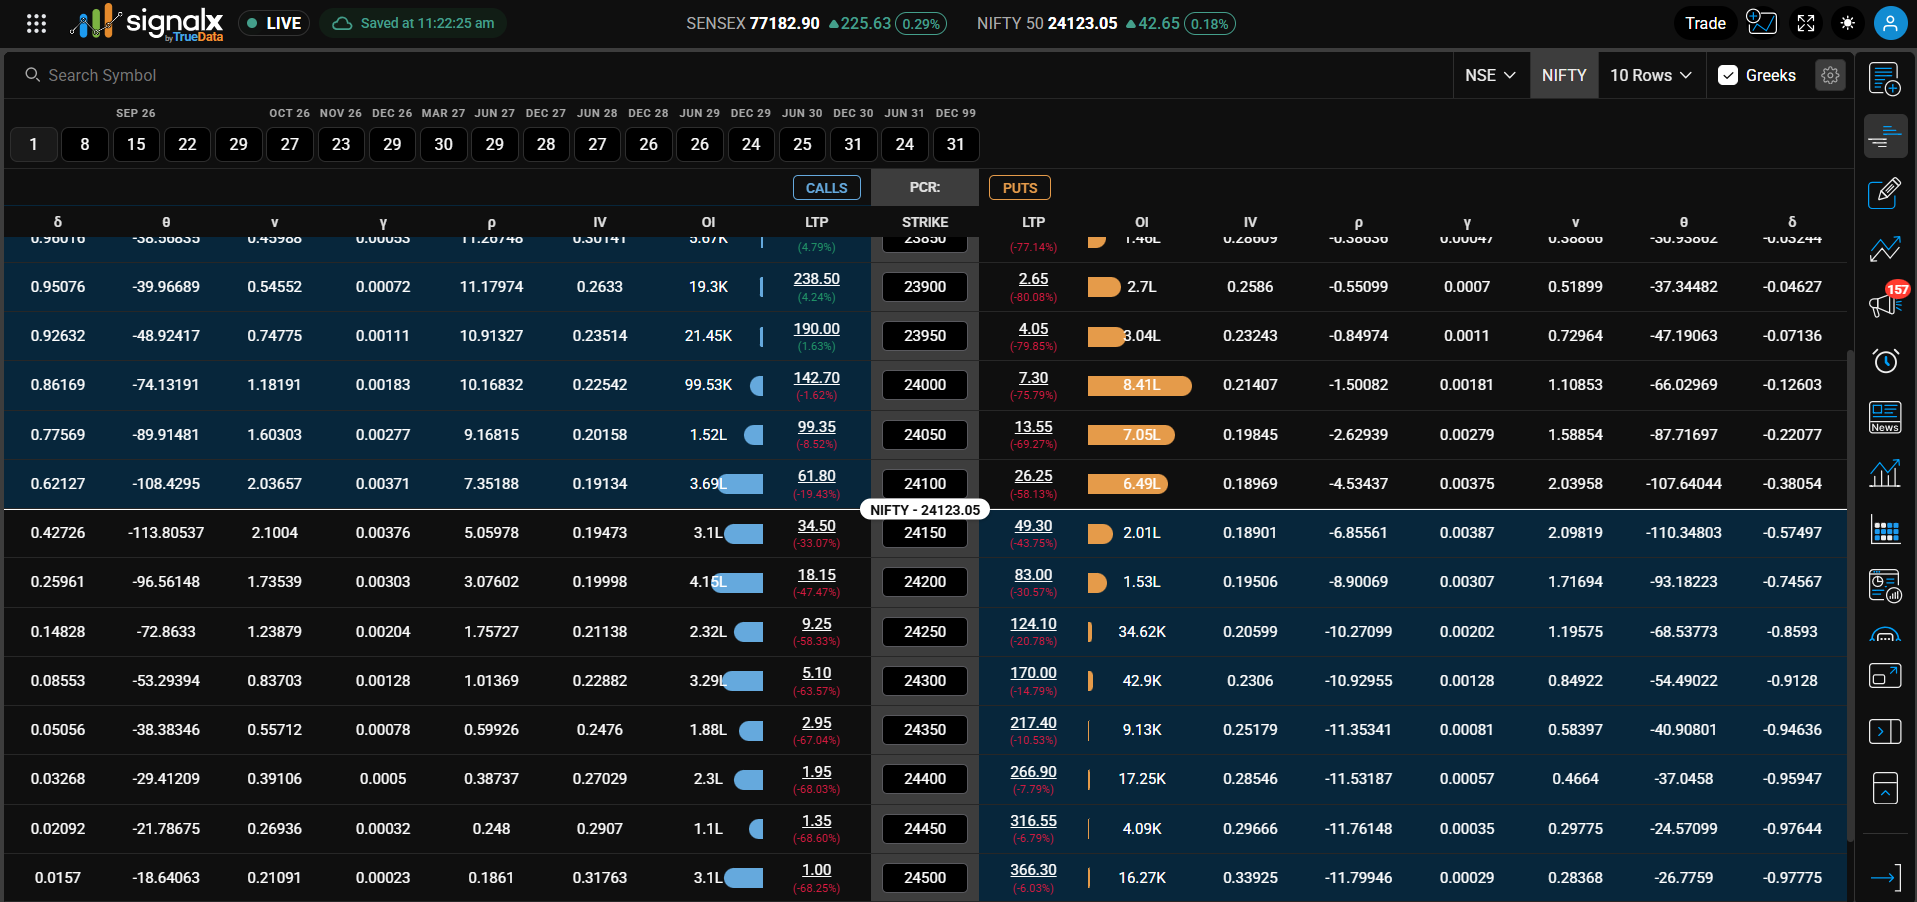
View live strike-wise Call and Put data across NSE, BSE, and MCX - including NIFTY, BANKNIFTY, FINNIFTY, and all F&O stocks - with OI, IV, LTP, Greeks, and PCR, directly inside SignalX, docked right alongside your chart.
info
Free plan: the option chain is available on the Free plan with a delayed feed. Paid plans get real-time data.
Access live option data in 4 steps from any chart screen
Click the Overlay Panel icon in the right-hand toolbar
Look for the vertical icon rail on the far right edge of the screen. Click the "Overlay Panel" icon (the bracket-style icon) to dock the option chain panel next to your chart.
Select exchange and underlying symbol
Use the exchange dropdown (top-right of the panel) to choose NSE, BSE, or MCX, then use the Search Symbol box or the symbol selector to choose NIFTY, BANKNIFTY, FINNIFTY, any F&O stock, or an MCX commodity.
Choose the expiry date
Select from the expiry date tabs - spanning weekly and monthly contracts across multiple months out. The nearest expiry is active by default. The selected symbol is shown on this same row, so you always see what you're viewing.
Toggle Greeks and pick your columns
Use the Greeks checkbox (top-right) to show or hide δ, θ, ν, γ, ρ columns. Click the gear icon next to it to open the Columns menu and choose exactly which fields appear, and how many rows to display via the "Rows" dropdown.
Every column available in the option chain table, toggled from the Columns menu (gear icon)
Core columns - both CE and PE sides
Column · Description
The predefined price at which the underlying asset can be bought or sold. Strikes near the live spot price (shown as a floating spot-price marker, e.g. "NIFTY - 24105.30") are highlighted, and the row is split by a divider line marking the ATM boundary.
Shows the latest traded premium of the option contract, with the percentage change from the previous close shown directly underneath in green or red.
Represents the total number of active option contracts at a particular strike price, displayed in lakhs/crores (e.g. "8.72L") when Lakh-Cr Format is enabled. Higher OI often indicates stronger market participation at that level.
Displays the percentage change in the option premium compared to the previous closing price, shown inline below the LTP figure.
Shows the market's expected volatility for the option. Higher IV usually means higher option premiums and increased expected price movement. Shown as a percentage (e.g. 20.65%).
Optional columns - toggled individually from the Columns menu
Column · Description
BID / ASK
Best bid/ask price
The best available buy (bid) and sell (ask) prices currently quoted in the market for that strike.
BIDQTY / ASKQTY
Quantity at best bid/ask
The quantity of contracts available at the best bid and best ask prices.
POI
Previous Open Interest
The open interest recorded at the previous session's close, useful for comparing against the current OI to gauge fresh positioning.
The total number of contracts traded at that strike during the session so far.
TIMESTAMP
Last update time
The time the last trade or quote update was received for that strike's contract.
Greeks columns - shown when the Greeks checkbox (or individual toggles) is enabled
Symbol · Name · Description
Measures how much the option premium changes for a ?1 move in the underlying asset. Delta also indicates directional sensitivity.
Represents time decay - how much value the option loses each day as expiry approaches, assuming other factors remain constant.
Measures the sensitivity of the option premium to changes in Implied Volatility (IV). Higher Vega means IV changes affect the premium more.
Represents the rate of change of Delta as the underlying price moves. Gamma is highest for ATM options near expiry.
Measures how much the option price changes when interest rates move. Rho has a bigger impact on long-expiry options.
straighten
Natural units: Greeks are shown in their natural units (not scaled), and IV is shown as a percentage. For more precision, turn on 5 Decimals (Greeks) in the Display settings.
tips_and_updates
OI bars: When the OI Bars display option is enabled, a horizontal bar next to each OI number gives a visual sense of relative open interest across all strikes. Blue bars = Call OI, orange/amber bars = Put OI. The widest bar on each side marks the heaviest positioned strike - typically your key resistance (CE) and support (PE) levels for the expiry.
Put-Call Ratio, shown at the top of the Strike column
PCR is the ratio of total Put OI to total Call OI for the selected expiry. A PCR above 1 generally suggests more Put positioning (often read as bullish sentiment, since Puts are being written), while a PCR below 1 suggests more Call positioning (often read as bearish sentiment). PCR is best used alongside price action rather than in isolation.
Reading OI change alongside price movement
Price · OI · Signal · What it means
Price ↑ + OI ↑
Bullish
Fresh longs being added. New money entering the uptrend. Strong confirmation - hold or add to long positions.
Price ↑ + OI ↓
Short covering
Shorts being unwound, not fresh buying. Rally may lack follow-through. Approach new longs cautiously.
Price ↓ + OI ↑
Bearish
New short positions being built. Institutional distribution in progress. Downtrend likely to continue.
Price ↓ + OI ↓
Long unwinding
Longs exiting, not fresh shorts. Selling pressure may exhaust soon. Watch for a potential base formation.
Sensitivity measures shown when Greeks columns are enabled
δ
Delta
0 to 1 (CE) / -1 to 0 (PE)
How much the option price moves per ?1 change in the underlying. ATM ≈ ±0.50. Also approximates the probability of expiring ITM.
γ
Gamma
Highest at ATM near expiry
Rate of delta change per ?1 move. High gamma = delta flips fast. ATM options on expiry day have extreme gamma - size carefully.
θ
Theta
Always negative for buyers
Daily time decay. How much the option loses per day. Accelerates sharply in the final 7 days before expiry. Sellers collect theta.
ν
Vega
Positive for option buyers
Change in price per 1% IV move. Buy before major events when IV is low; sell after the event when IV collapses (IV crush).
tips_and_updates
Enable the Greeks checkbox (top-right of the option chain header) to show δ, θ, ν, γ, and ρ columns alongside OI, IV, and LTP for every strike on both the CE and PE sides. For finer control, open the gear icon next to it to toggle each Greek (and every other column) individually.
Opened via the gear icon next to the Greeks checkbox
The gear icon opens a panel with two sections. Under Columns, individually check or uncheck: BID, BIDQTY, ASK, ASKQTY, CHG, OI, POI, VOL, LTP, TIMESTAMP, DELTA, GAMMA, THETA, VEGA, RHO, and IV. Under Display, toggle:
OI Bars
Show or hide the relative-OI bar visualization next to the OI figures.
Real-time
Toggle live streaming updates for the option chain data on or off. Rows stream in live, with no polling or manual refresh needed.
Lakh-Cr Format
Display large OI/volume figures in lakhs and crores (e.g. "8.72L") instead of full numbers.
Lot Size
Show contract lot size alongside relevant figures where applicable.
5 Decimals (Greeks)
Show Greek values to 5 decimal places for finer precision, instead of the default rounding.
Additional controls available in the docked panel
Multi-expiry tabs
All expiry dates are shown as tabs at the top - weekly and monthly contracts across multiple months - next to the selected symbol. Switch instantly without leaving the chain.
Row count control
The "Rows" dropdown (e.g. "10 Rows") in the header lets you control how many strikes are visible above/below the ATM strike at once.
OI bars
Visual bars next to each OI number - blue for Calls, orange for Puts - scale relative to the heaviest strike, making support/resistance instantly visible.
Expand over the chart
Use the toggle on the pane's edge to expand the option chain over the chart for a bigger view, and toggle it again to dock it back alongside the chart.