AutoTrend
NewAutomatically detect and draw trend lines and key price levels on the chart - no manual anchoring required.
AutoTrend analyses the price action visible on your chart and draws the lines for you. Open it from the left drawing toolbar and choose AutoTrend Horizontal or AutoTrend Diagonal from the dropdown. The lines are recalculated for the timeframe you are viewing, so switching timeframes gives you the structure for that timeframe.
Where to find AutoTrend
AutoTrend is available in the left drawing toolbar. Click the icon to open the dropdown with the Horizontal and Diagonal options.
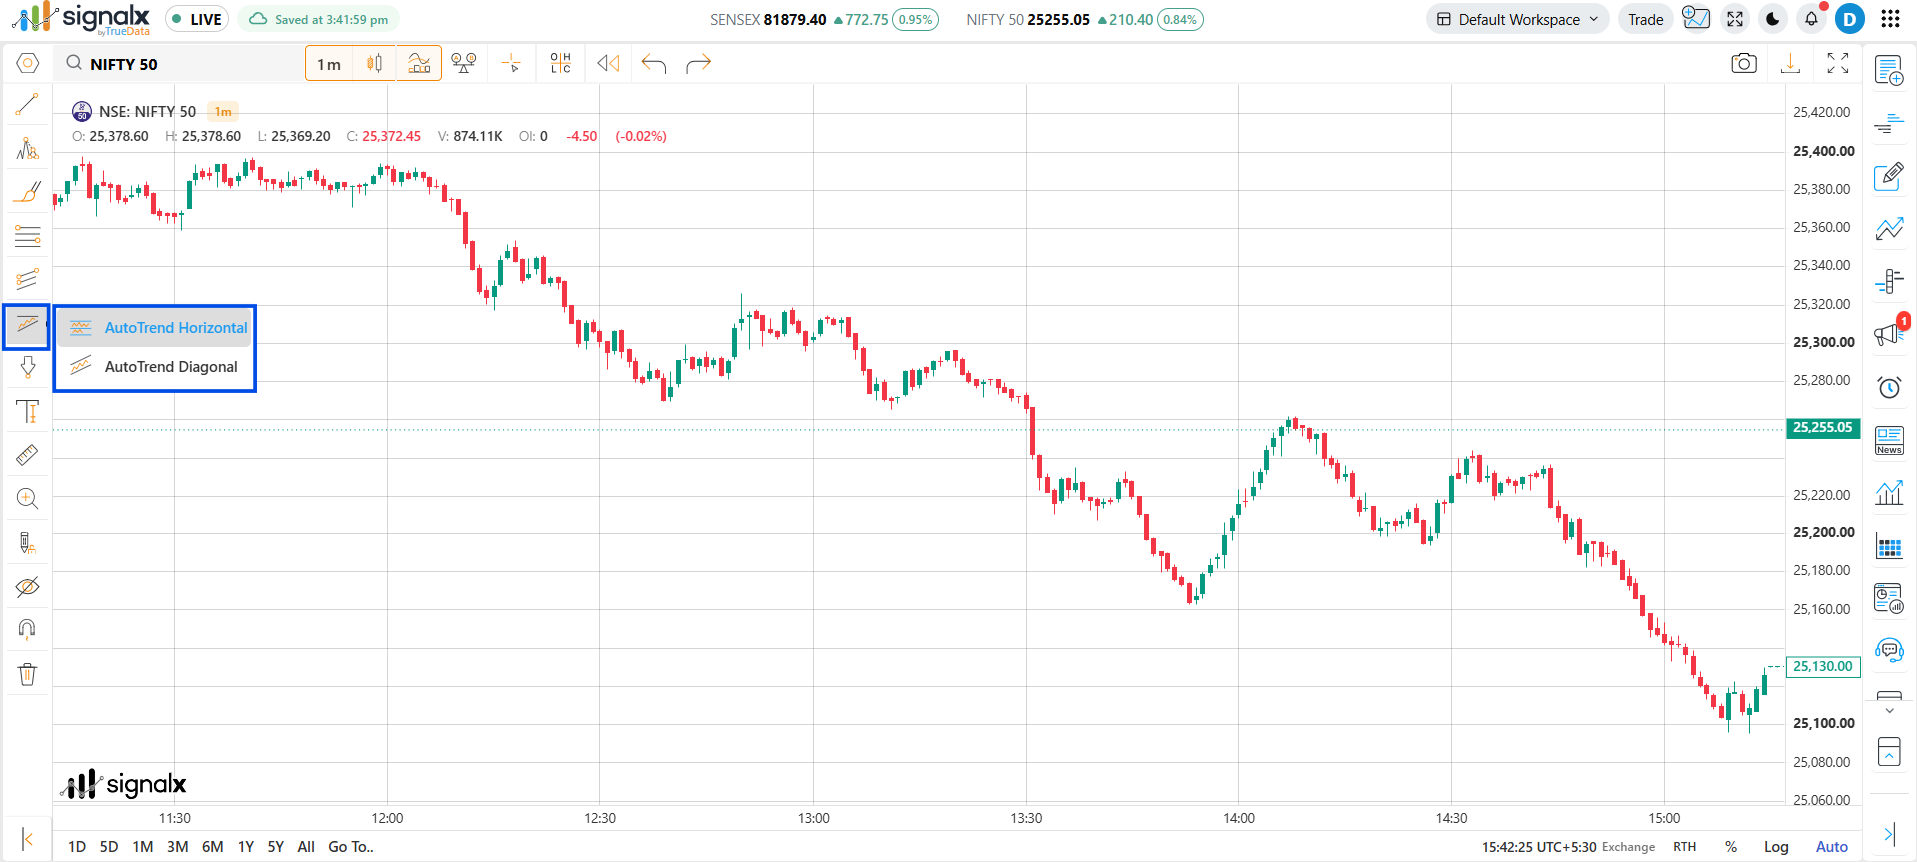
AutoTrend Horizontal
Automatically draws horizontal lines at the key support and resistance levels where price has repeatedly reacted. Use it to quickly see important price zones, possible breakout levels and areas where price may pause or reverse, without marking each level by hand.
AutoTrend Diagonal
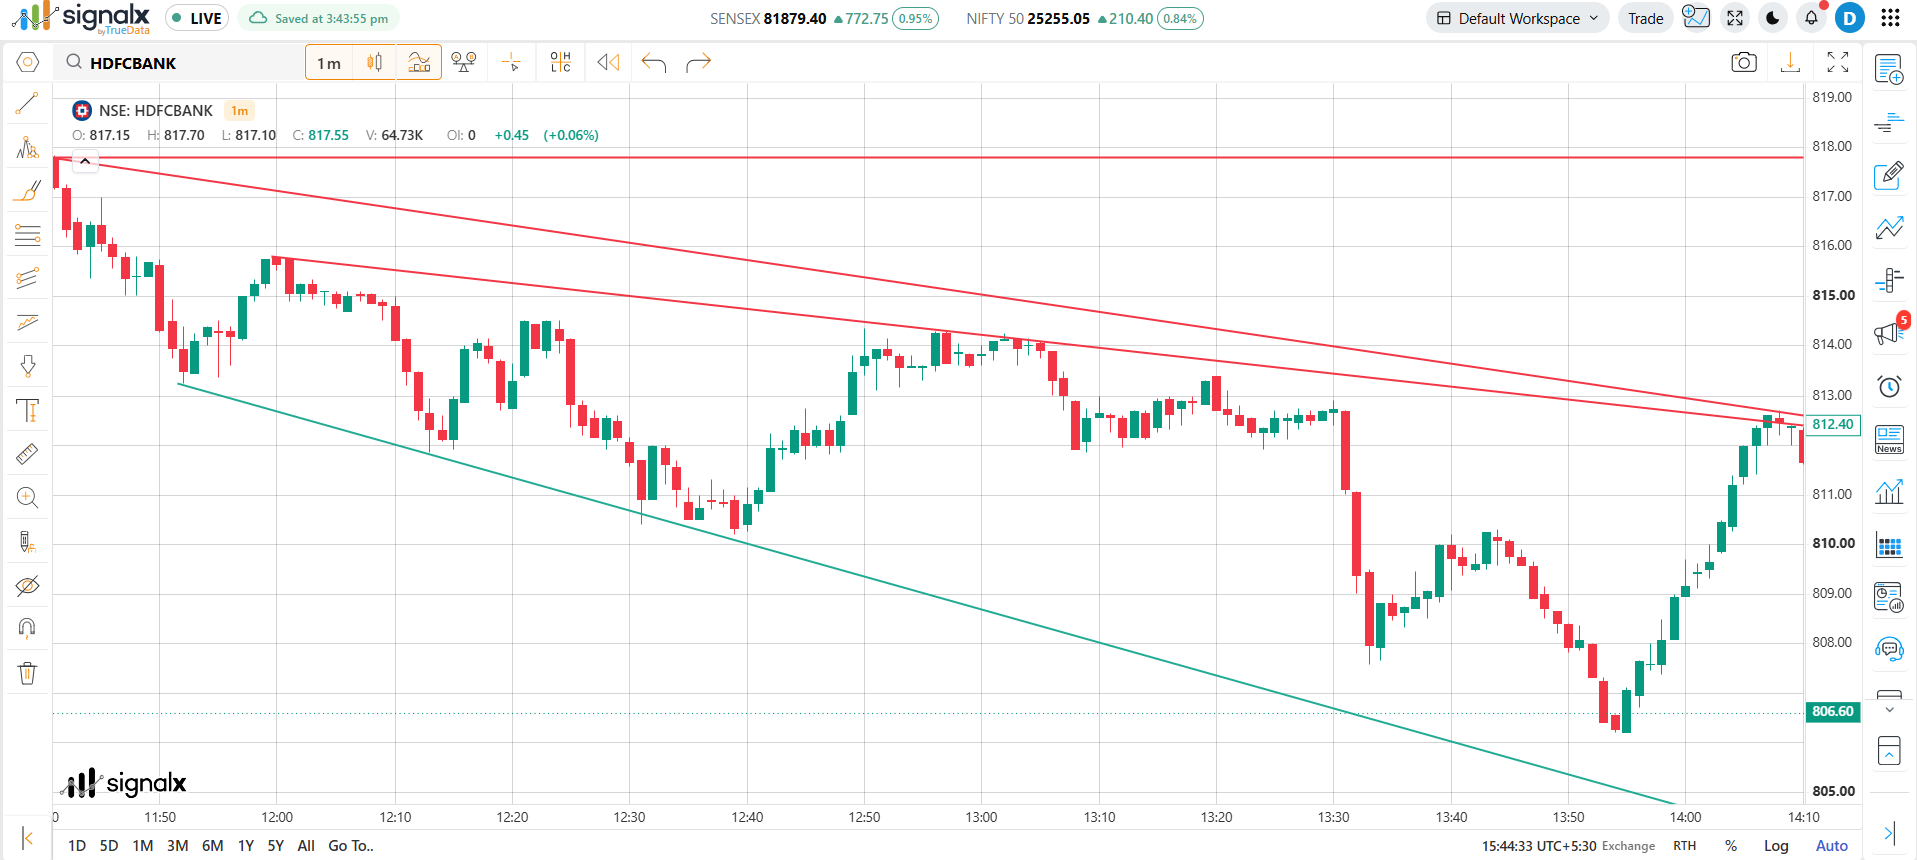
Automatically draws diagonal trend lines along the swing highs and swing lows of the current move. Resistance lines slope along lower highs in a downtrend, and support lines slope along higher lows in an uptrend. Use it to spot the trend direction, channels and potential trend-line breakouts at a glance.
How AutoTrend plots trend lines
Once selected, AutoTrend draws the lines on the chart by itself. The example below shows the lines plotted along the swing highs and lows of the visible price action.
How to use
- Click the AutoTrend icon in the left drawing toolbar.
- Select AutoTrend Horizontal or AutoTrend Diagonal from the dropdown.
- The lines are drawn on the chart automatically.
- Use Hide Drawings or Remove All Drawings to hide or clear them.