Options Strategy Builder
Build, visualise, and analyse multi-leg options strategies with a live payoff diagram. Click B or S on any strike in the option chain - the builder instantly calculates Max Profit, Max Loss, P.O.P, Breakeven, and required margins.
Interface Overview
Three zones in the expanded Overlay Panel view: Option Chain (left), Payoff Chart (top right), Strategy Basket (bottom right).
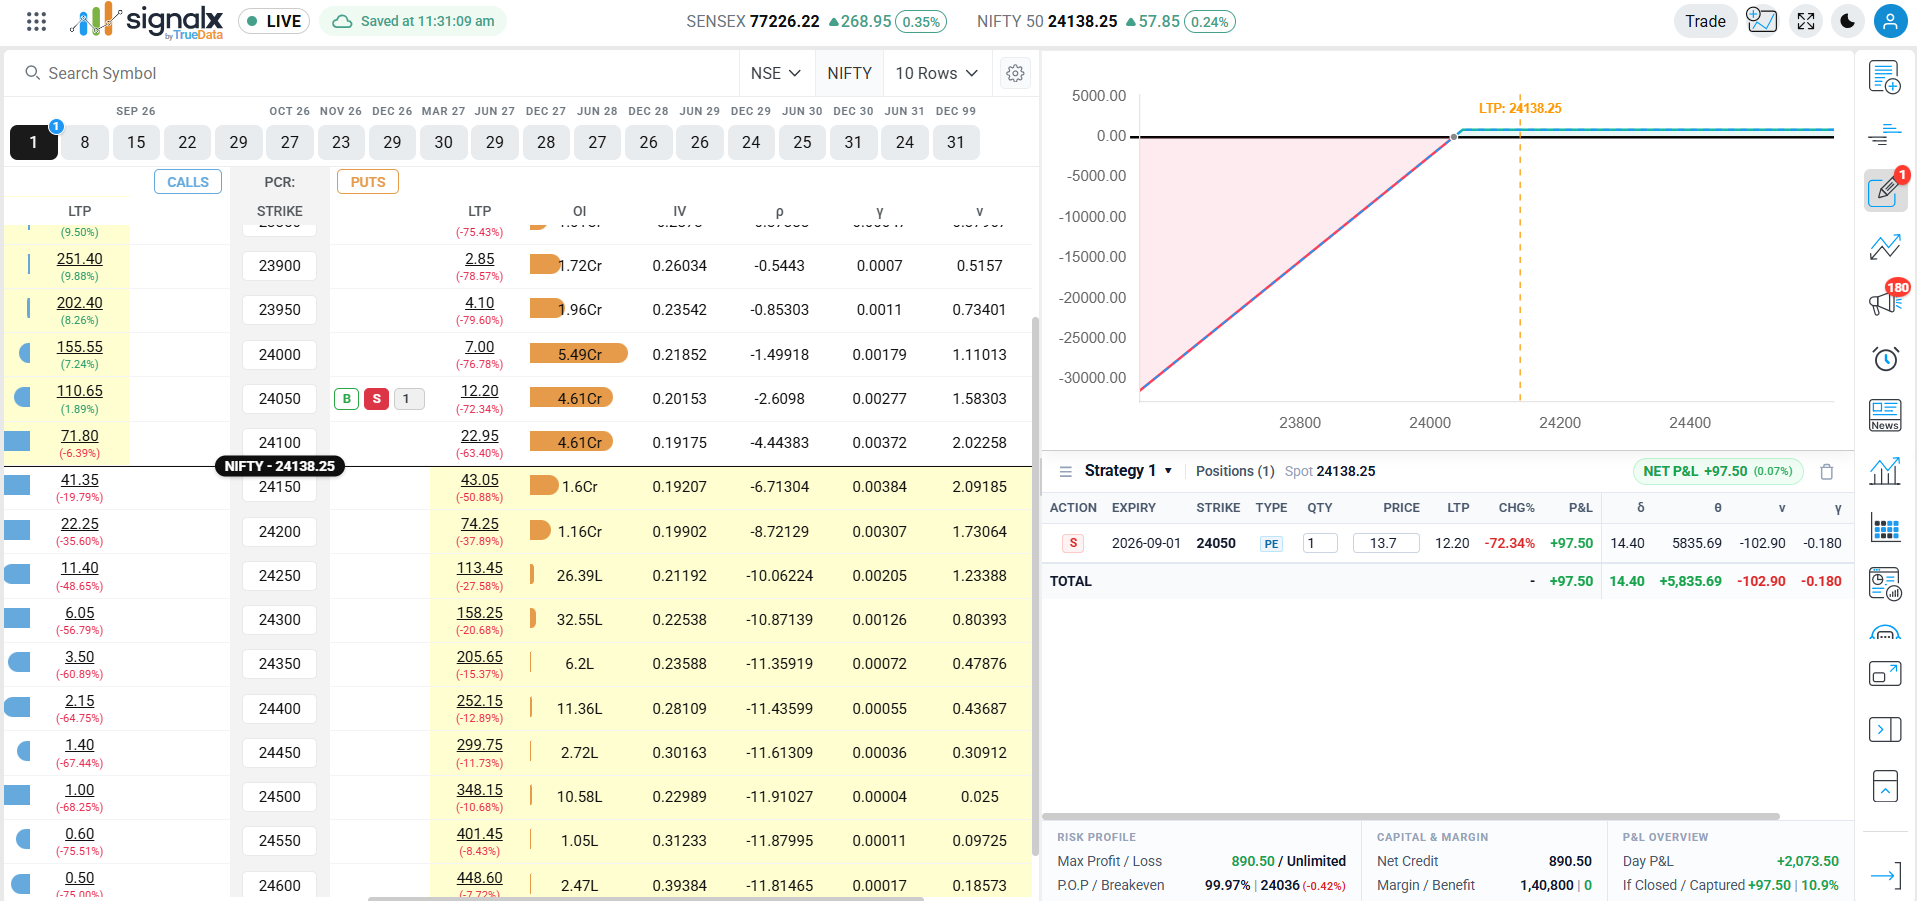
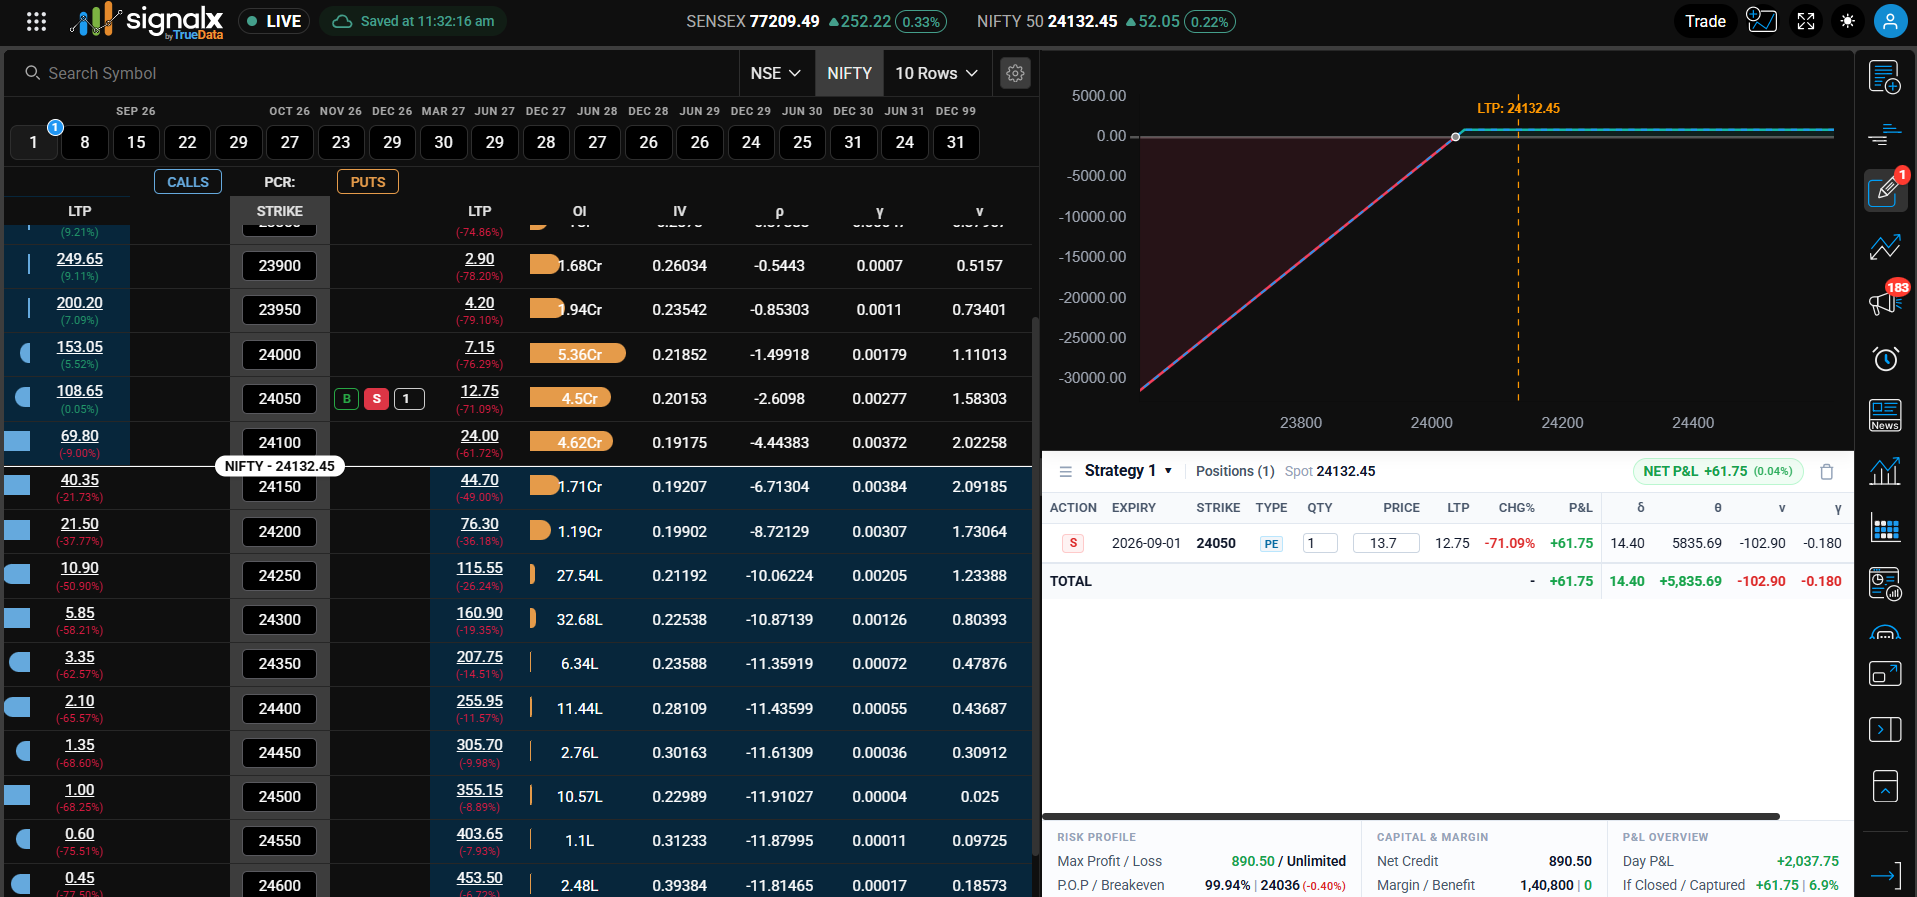
Click B (Buy, green) or S (Sell, red) directly on any CE or PE strike row. A quantity stepper appears next to the chosen action. The payoff chart, Greeks, and all summary figures update instantly as you build the basket.
How to Use the Strategy Builder
Build a multi-leg strategy in 5 steps.
Reading the Payoff Diagram
Understanding what each element of the chart represents.
Blue Payoff Curve
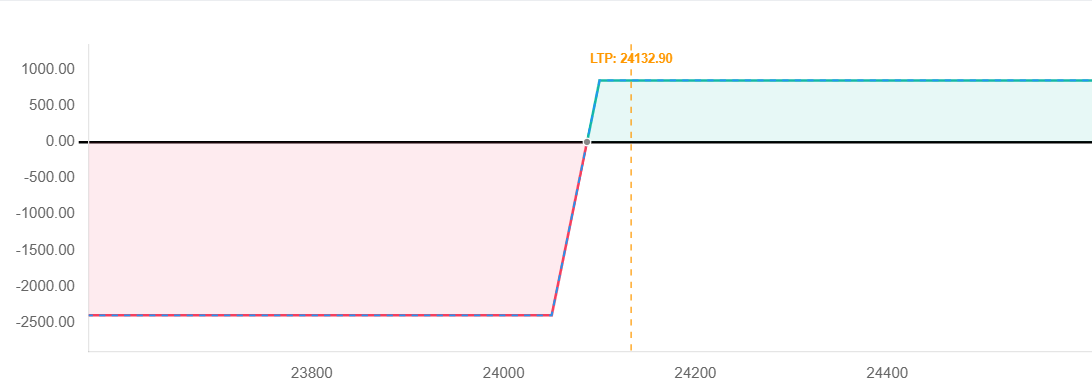
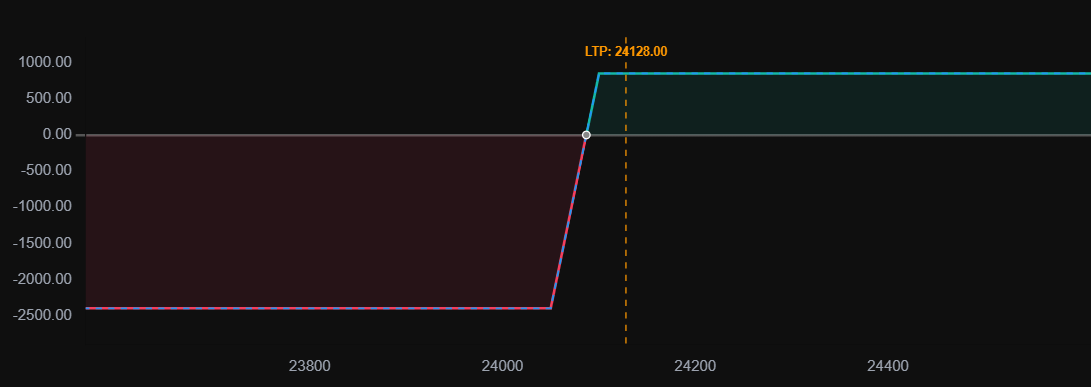
Represents the strategy's payoff at expiry across different underlying prices. The shaded area under the curve indicates profit or loss magnitude at each price level.
Hover Data Point
Moving the cursor along the payoff curve displays the exact underlying price and P&L value at that point.
Orange Dashed LTP Line
A vertical dashed line marks the current market price (LTP) of the underlying asset, letting you see at a glance where the position sits on the payoff curve right now.
Breakeven / Zero P&L Line
The horizontal black line represents zero profit and loss. The point where the payoff curve crosses this line is the breakeven level.
Strategy Basket
Every leg you've added, with live pricing and Greeks per row.
The basket header shows the strategy name (e.g. "Strategy 1", editable via dropdown), the number of open positions, the live Spot price of the underlying, and a running NET P&L badge that turns green or red based on the combined position. Each row in the table below shows:
Strategy Summary Metrics
Three grouped panels below the basket: Risk Profile, Capital & Margin, and P&L Overview.
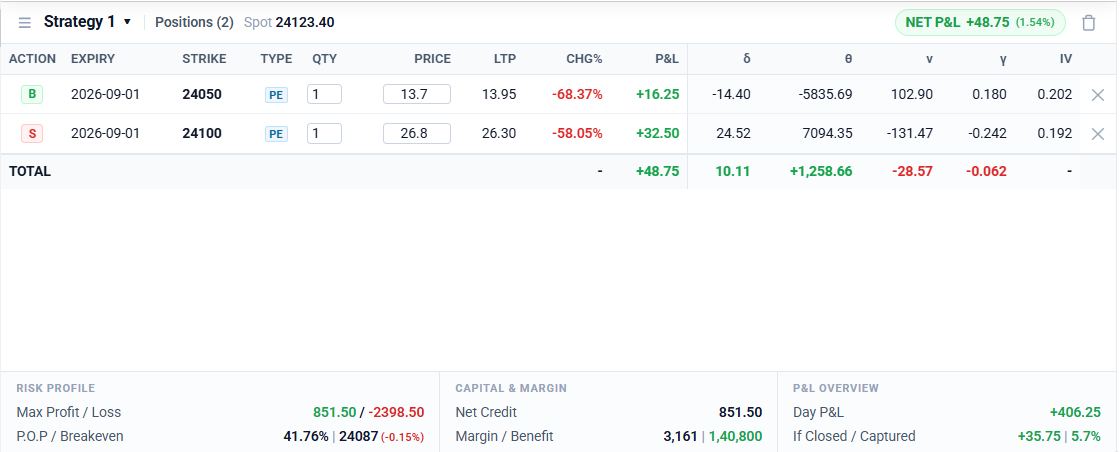
Risk Profile
The best- and worst-case P&L for the current basket. Naked option positions can show "Unlimited" on either side depending on direction.
Probability of Profit (estimated likelihood of expiring in profit based on current IV and pricing) alongside the breakeven underlying price.
Capital & Margin
The net amount paid (debit) or received (credit) to enter the basket, based on the entry prices of all legs.
Margin required to hold the position, and any margin benefit gained from hedged/spread legs offsetting each other.
P&L Overview
The live profit or loss on the basket for the current trading session, updating in real time as prices move.
The P&L that would be realised if the position were closed right now, and the P&L already captured/booked, if any.
Pro Tips
One-click from Option Chain
Click B or S on any strike in the Option Chain to instantly add that leg to the active basket without re-entering the strike manually.
Compare P.O.P across strikes
Check P.O.P for multiple strike combinations. A P.O.P above 60% for a credit spread means statistical edge - but weigh that against max loss width.
Expiry selection matters
Weekly expiries have faster theta decay (good for sellers) but higher gamma risk. Monthly expiries give more time but premiums are higher.
Use spreads to cut margins
Adding a far-OTM hedge to a naked short converts it to a spread - slashing margin requirements while capping maximum loss.
On expiry day, avoid adding new positions in the final 30 minutes - gamma is at its peak. Use the P.O.P figure to assess risk before acting on any strategy.