Chart Sync
Keep multiple chart panels coordinated without extra clicks - synchronise crosshair, chart type, interval, symbol, session, drag, zoom, and indicators across every open panel.
Chart Sync Overview
When multiple chart panels are open, SignalX can synchronise them across crosshair, chart type, interval, symbol, session, drag, zoom, and indicators. All 8 sync toggles live in one central place - the Sync Events tab inside Chart Settings.
Open a multi-chart layout
Click the grid icon in the top toolbar and select your preferred layout - 1×2, 2×2, or 2×3. Each panel is independent by default.
Open Chart Settings
Right-click anywhere on the chart canvas and select Chart Settings from the context menu to open the settings dialog.
Switch to the Sync Events tab
Inside Chart Settings, the left-hand menu lists Chart Settings, Hot keys, Market Events, and Sync Events. Click Sync Events to see all sync toggles in one place.
Enable the sync modes you need, then Apply
The Sync Events tab shows all 8 toggles - Crosshair, Chart Type, Interval, Symbol, Session, Drag, Zoom, and Indicators. Toggle any combination, then click Apply. Some sync types are also available as a quick toggle inside their own popup, without opening Chart Settings at all.
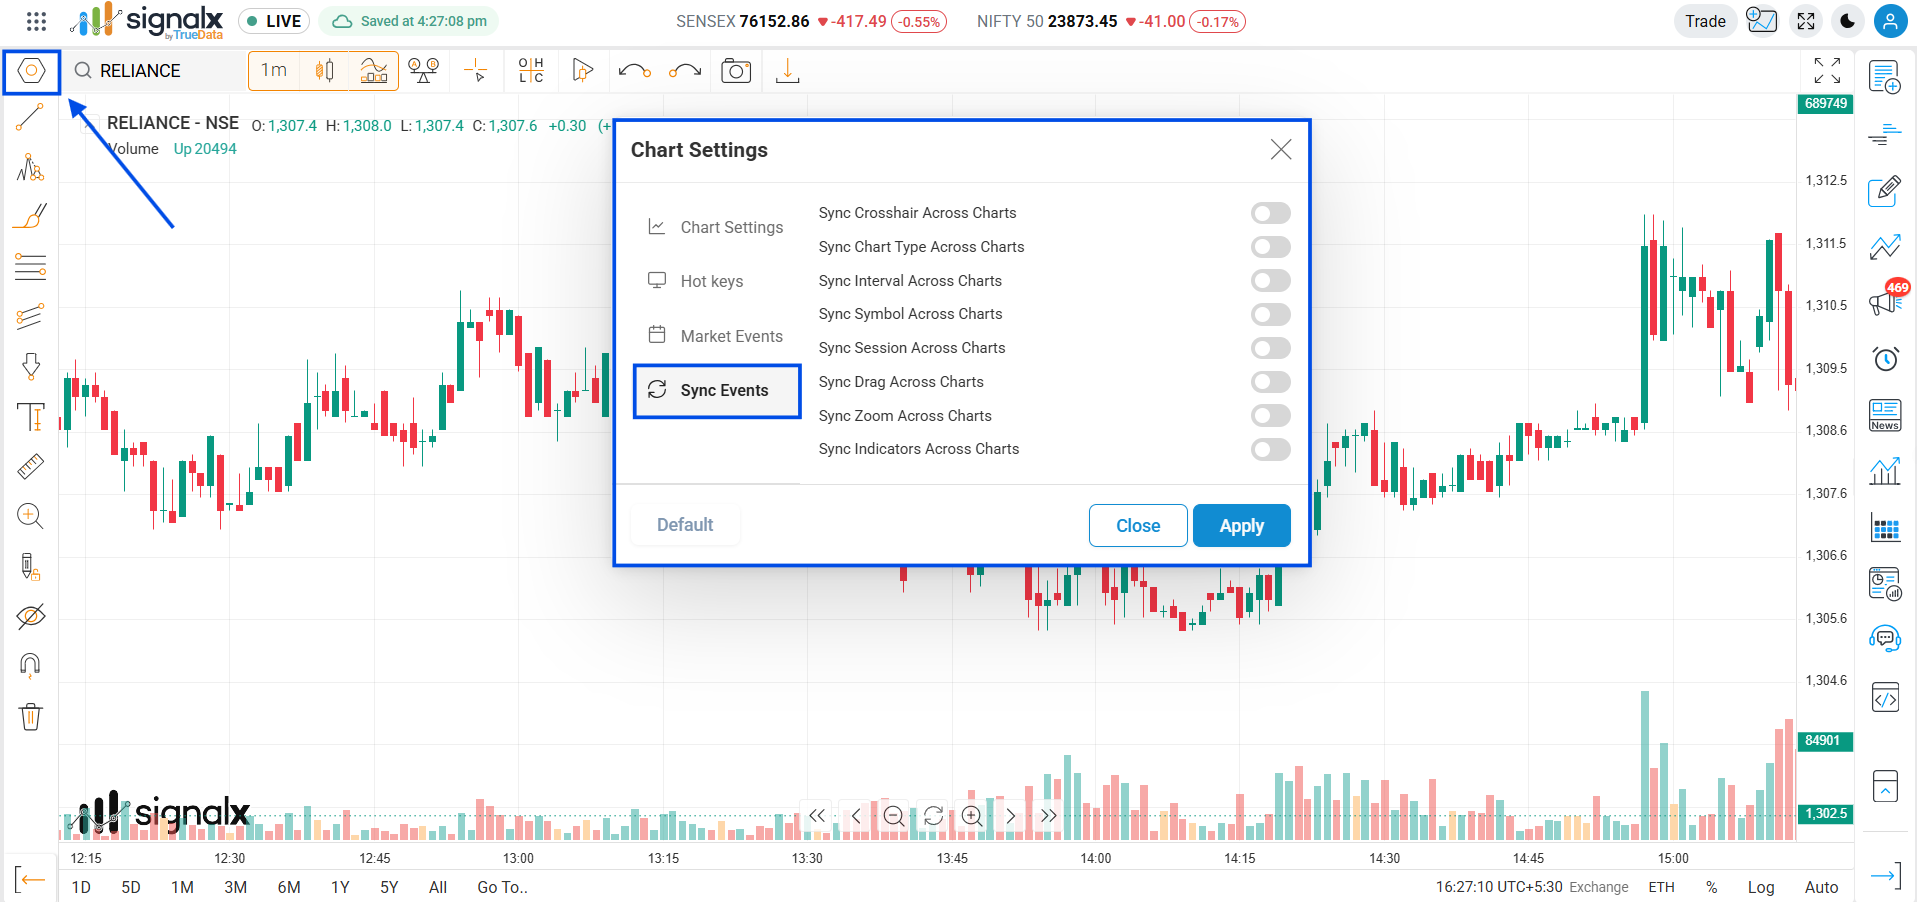
Symbol and Session sync are only available from the Sync Events tab in Chart Settings. Crosshair, Drag, Zoom, Interval, Chart Type, and Indicators sync are also accessible as quick toggles from their respective popups - details in the sections below.
Sync Crosshair
Moving the crosshair in one panel projects it at the same time point across all other open chart panels simultaneously.
Sync Chart Type
Switching between Candlestick, Heikin Ashi, Line, or any other chart type in one panel mirrors the change across all synced panels.
Sync Interval
Changing the timeframe in any one panel updates all synced panels to the same interval simultaneously.
Sync Symbol
Changing the symbol on one chart loads the same symbol on all other synced panels - useful for multi-timeframe analysis on one instrument.
Sync Session
Session highlight settings (pre-market, post-market, extended hours) stay consistent across all synced chart panels.
Sync Drag
Clicking and dragging to pan in one panel scrolls all synced panels by the same amount in perfect lockstep.
Sync Zoom
Zooming in or out in one panel applies the same zoom level across all synced panels, keeping candle density consistent.
Sync Indicators
Indicators added or removed on one panel are mirrored across all synced panels with matching parameters.
You don't have to enable all sync modes. For multi-timeframe analysis on one symbol, use Interval + Crosshair + Drag. For comparing different symbols on the same timeframe, use Symbol + Zoom sync.
Timeframe Sync
Lock all open chart panels to the same interval. When you change the timeframe on any panel, every synced panel updates to match it instantly.
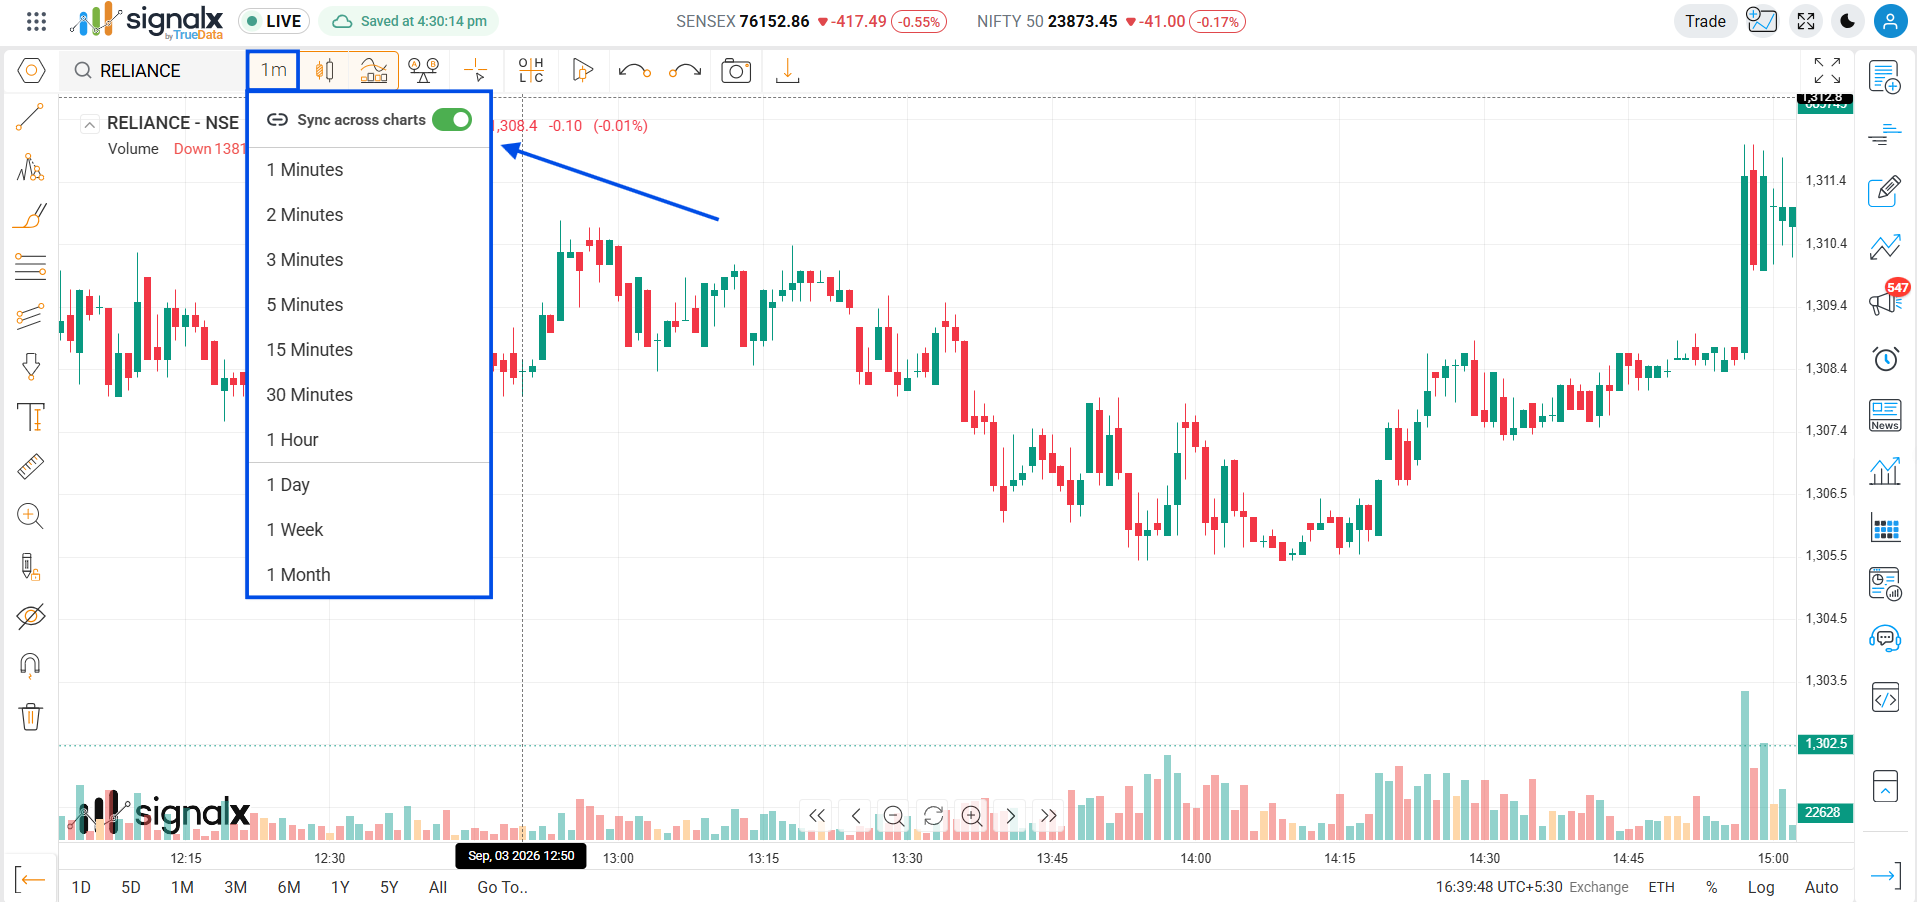
Timeframe sync ON
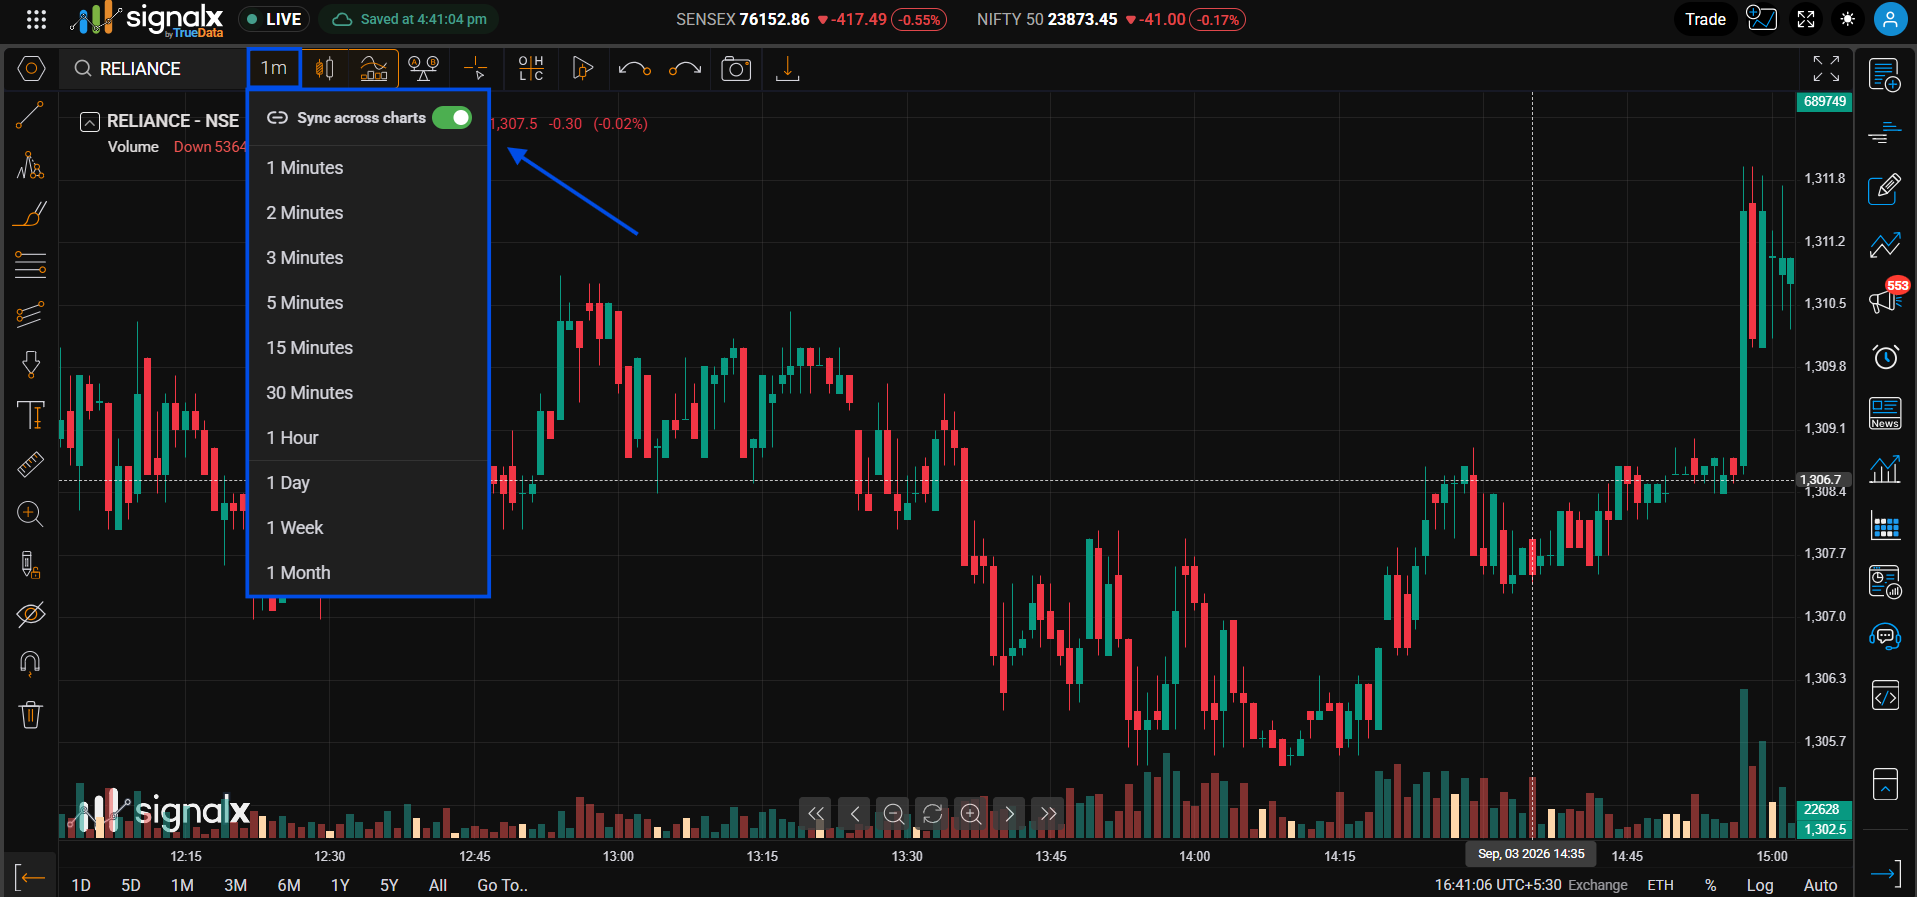
Timeframe sync OFF
How to access
Via Chart Settings
Right-click the chart → Chart Settings → Sync Events → toggle Sync Interval Across Charts → Apply.
Via Timeframe selector popup
Click the timeframe selector on any chart panel - a "Sync across charts" toggle sits at the top of that popup, above the list of intervals, for quick access without opening Chart Settings.
Toggle timeframe sync off temporarily when you want to zoom into a 1m chart on one panel while keeping a 1D view untouched on another. Re-enable when ready to align them again.
Crosshair Sync
Hover on one chart and a matching crosshair appears at the identical time point on all other synced panels - compare prices across symbols or timeframes at the exact same moment.
Simultaneous OHLC read
Hover over a candle and see the OHLC tooltip update across all panels at that same timestamp - compare open prices, highs, and lows at a specific moment without switching panels.
Cross-symbol comparison
Compare how NIFTY and BANKNIFTY behaved at the exact same moment. Great for spotting divergences, relative strength, and sector rotation during specific events.
Timeframe alignment
Hover over a 15m candle and the crosshair on your 1D panel snaps to the same calendar date - intuitive context switching between intraday and positional views.
How to access
Via Chart Settings
Right-click the chart → Chart Settings → Sync Events → toggle Sync Crosshair Across Charts → Apply.
Via Crosshair dropdown
Click the crosshair tool in the toolbar - Sync Crosshair, Sync Drag, and Sync Zoom toggles all sit at the top of that same dropdown, above the pointer-style options (Arrow, Point, Arrow with Floating Labels, Crosshairs).
Pair crosshair sync with drag sync for the most powerful multi-chart experience - pan to a time of interest and the crosshair follows precisely, so you never lose context between panels.
Drag Sync
Click and drag to scroll any synced chart - all other synced panels pan by the same distance at the same time. Browse price history across multiple charts without touching each one individually.
Drag + Crosshair sync
Pan to scroll and the crosshair follows precisely. Use together when reviewing historical sessions or backtesting patterns across multiple instruments.
Drag + Zoom sync
The most efficient multi-chart browsing mode. Set zoom once, navigate with drag - every synced panel updates in perfect unison.
Session review
Load today's session on a 5m chart and yesterday's on an adjacent panel. Drag sync lets you compare both windows at the same relative time offset simultaneously.
Backtesting side by side
Study how the same setup played out on two different instruments simultaneously. Drag through historical data on both charts with a single gesture.
How to access
Via Chart Settings
Right-click the chart → Chart Settings → Sync Events → toggle Sync Drag Across Charts → Apply.
Via Crosshair dropdown
Click the crosshair tool in the toolbar - the Sync Drag toggle sits at the top of that dropdown alongside Sync Crosshair and Sync Zoom.
Enable drag sync before a post-market review session. Drag through the day's price action on your main chart and every linked panel - futures, options, sector index - scrolls with it.
Zoom Sync
Scroll to zoom in or out on any one panel - all synced panels zoom to the same level simultaneously, keeping candle density and time range consistent across all views.
Consistent candle density
When comparing two symbols, zoom sync ensures both charts show the same number of candles - making side-by-side analysis fair and accurate.
One-gesture overview
Zoom out on one chart to see a broader market context - all linked panels zoom out together instantly without touching each panel separately.
One-gesture deep dive
Zoom into a specific candle cluster on one chart - all synced panels zoom to the same level, letting you analyse a specific window across all instruments simultaneously.
How to access
Via Chart Settings
Right-click the chart → Chart Settings → Sync Events → toggle Sync Zoom Across Charts → Apply.
Via Crosshair dropdown
Click the crosshair tool in the toolbar - the Sync Zoom toggle sits at the top of that dropdown alongside Sync Crosshair and Sync Drag.
Combine drag sync + zoom sync for the most efficient multi-chart browsing. Set zoom once, navigate with drag - every synced panel updates in perfect unison without extra gestures.
Chart Type Sync
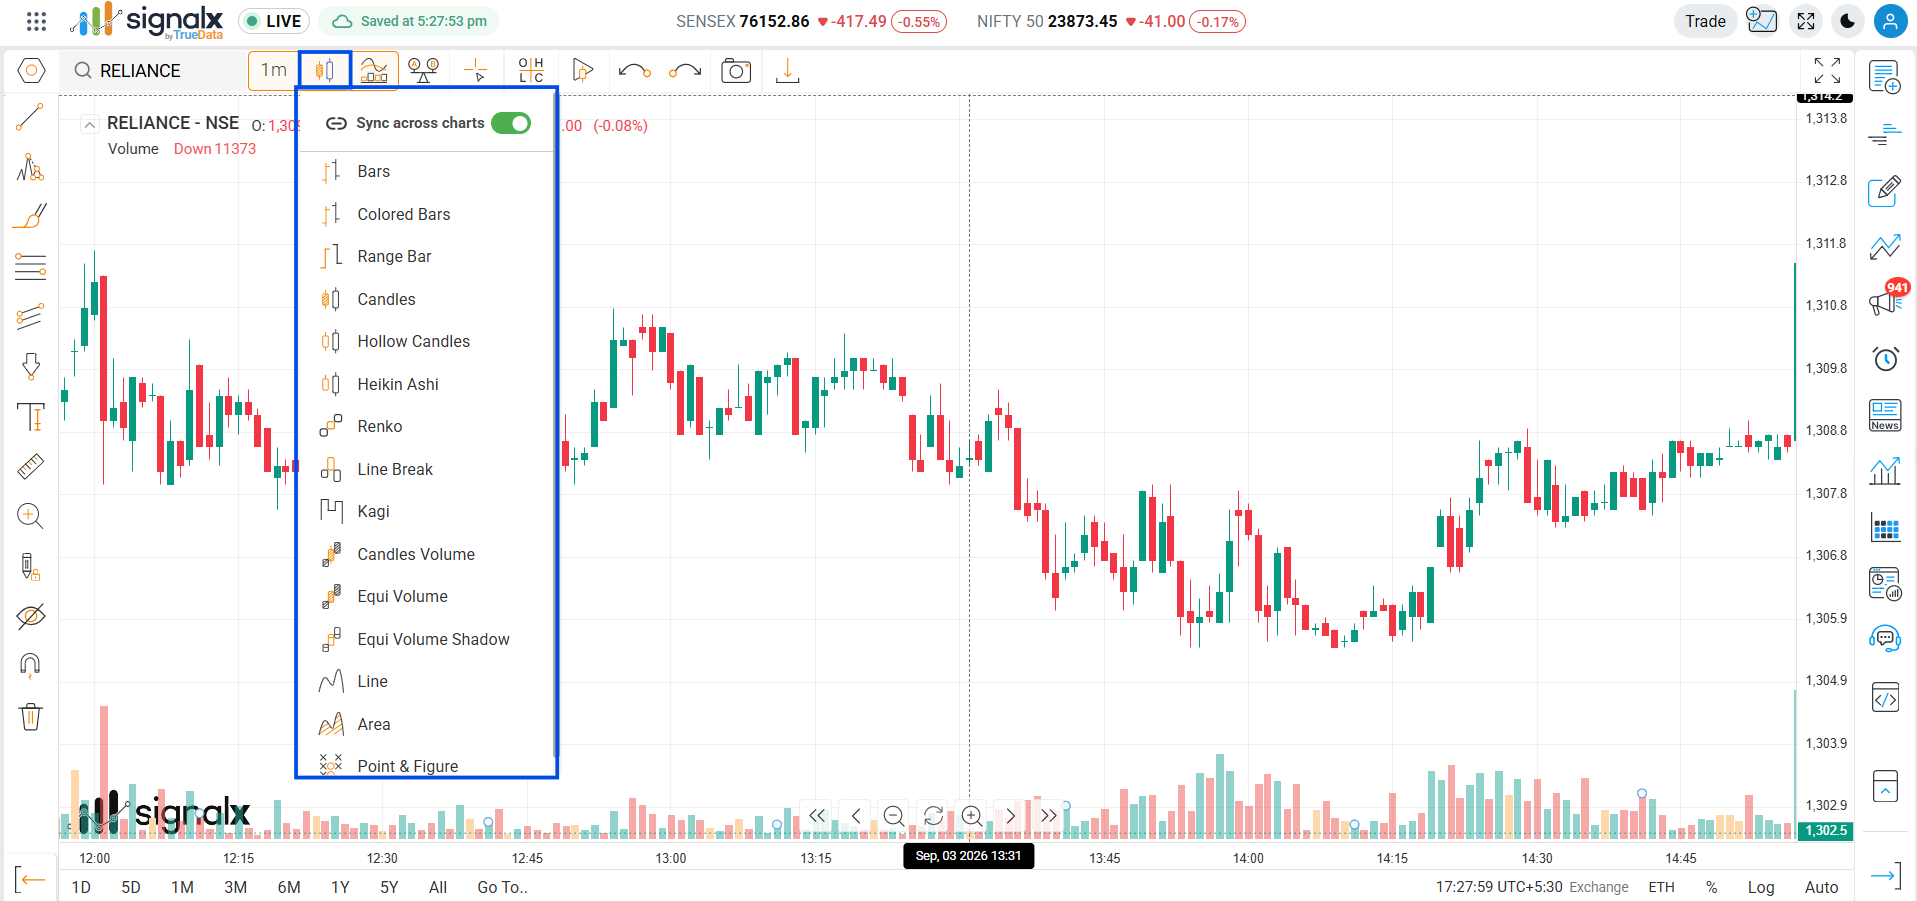
Switch between Candlestick, Heikin Ashi, Line, or any other chart type on one panel - all synced panels mirror the change instantly, keeping your visual analysis consistent across every chart.
How to access
Via Chart Settings
Right-click the chart → Chart Settings → Sync Events → toggle Sync Chart Type Across Charts → Apply.
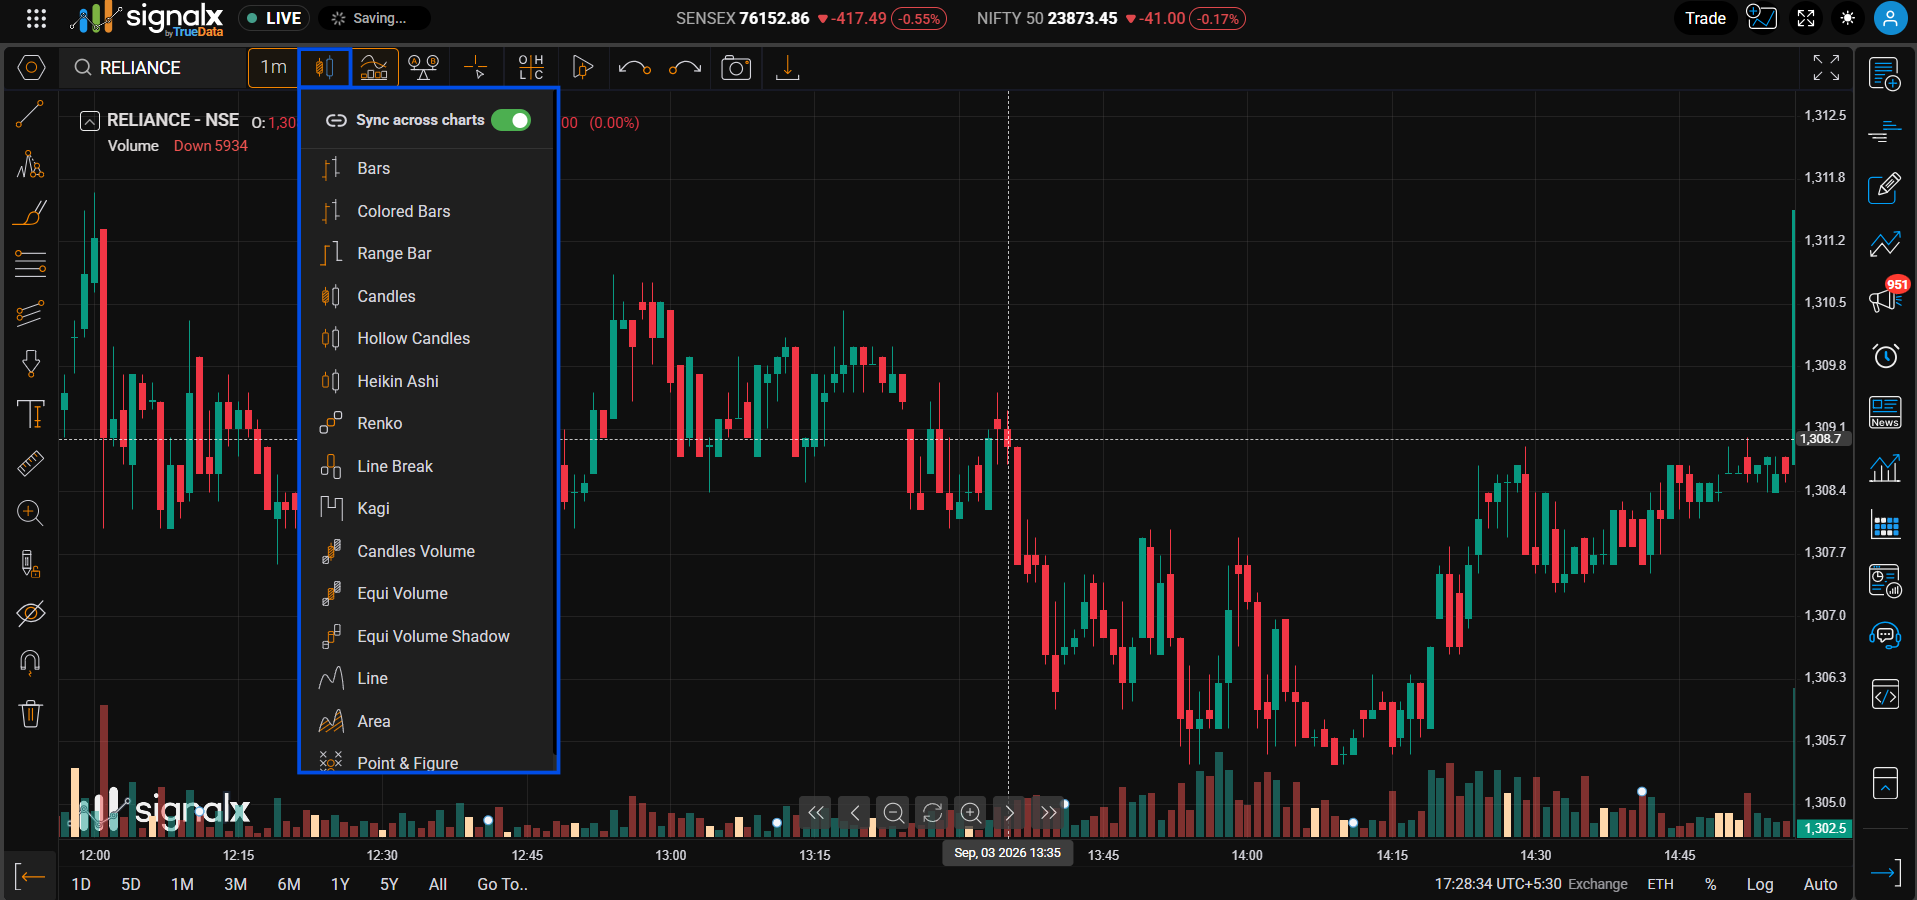
Via Chart type dropdown
Click the chart type button in the toolbar - a "Sync across charts" toggle sits at the top of that dropdown, above the list of chart types (Bars, Candles, Heikin Ashi, Renko, Line, and so on).
Switch to Heikin Ashi on one panel with chart type sync on - all panels update together, so you can instantly compare the smoothed HA view across all instruments simultaneously.
Session Sync
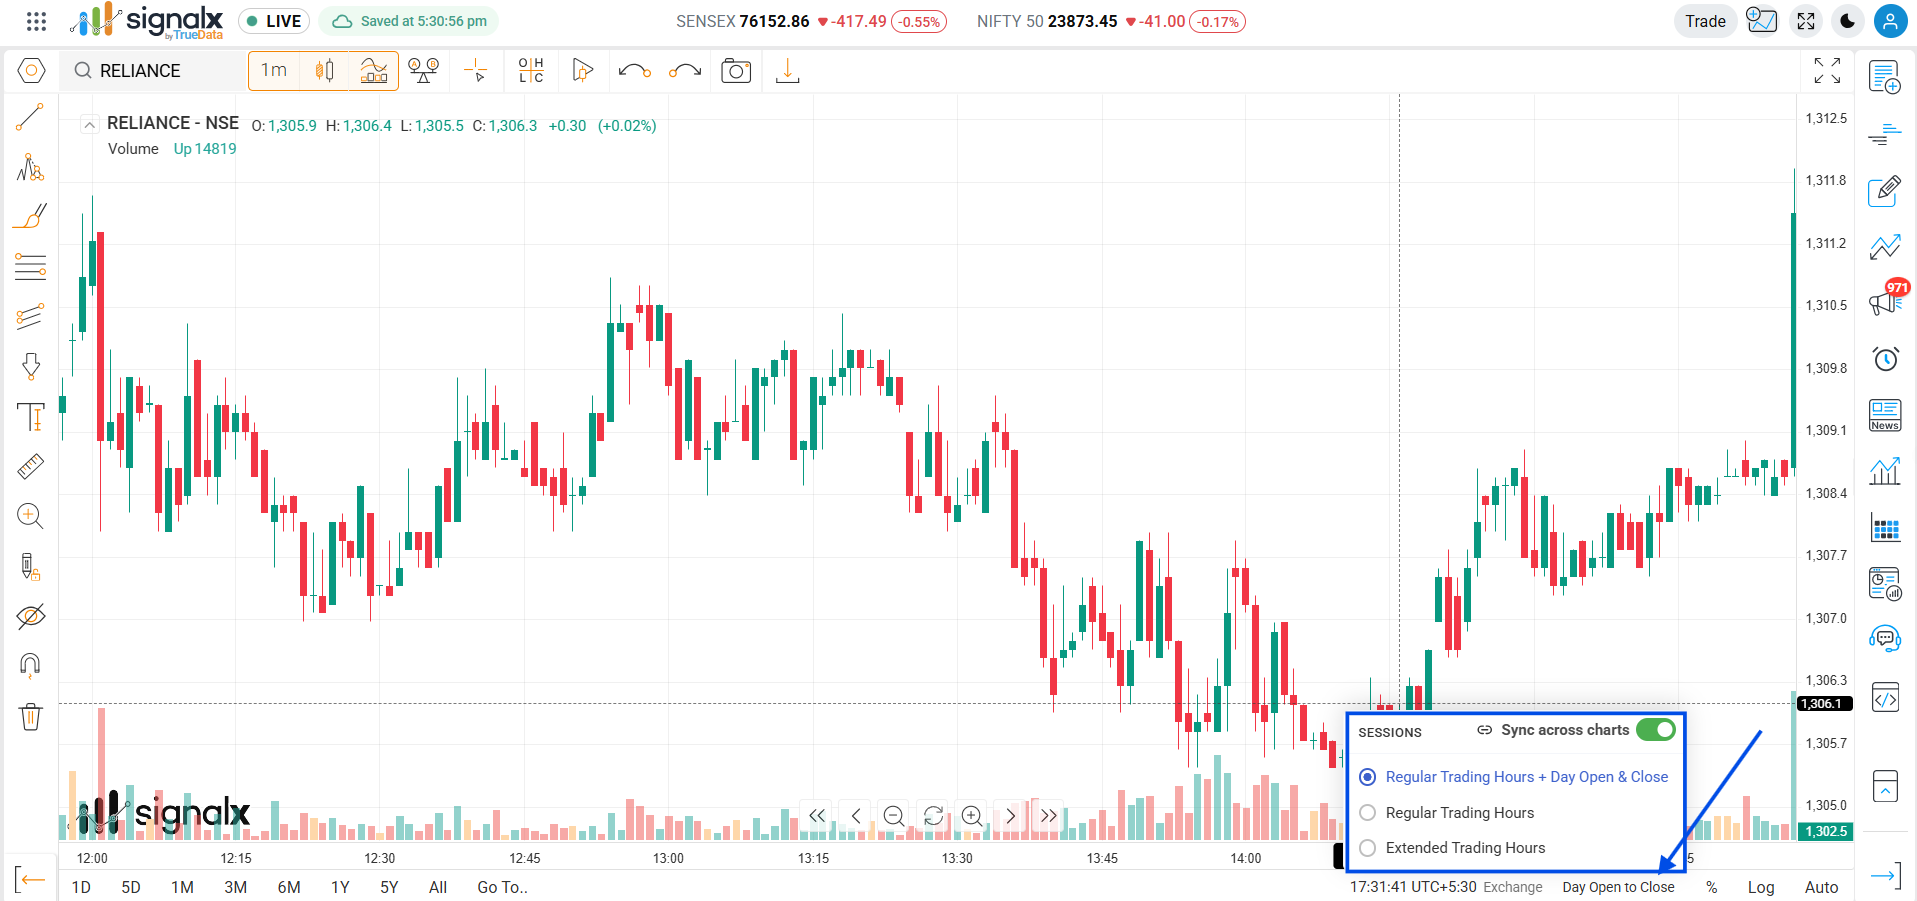
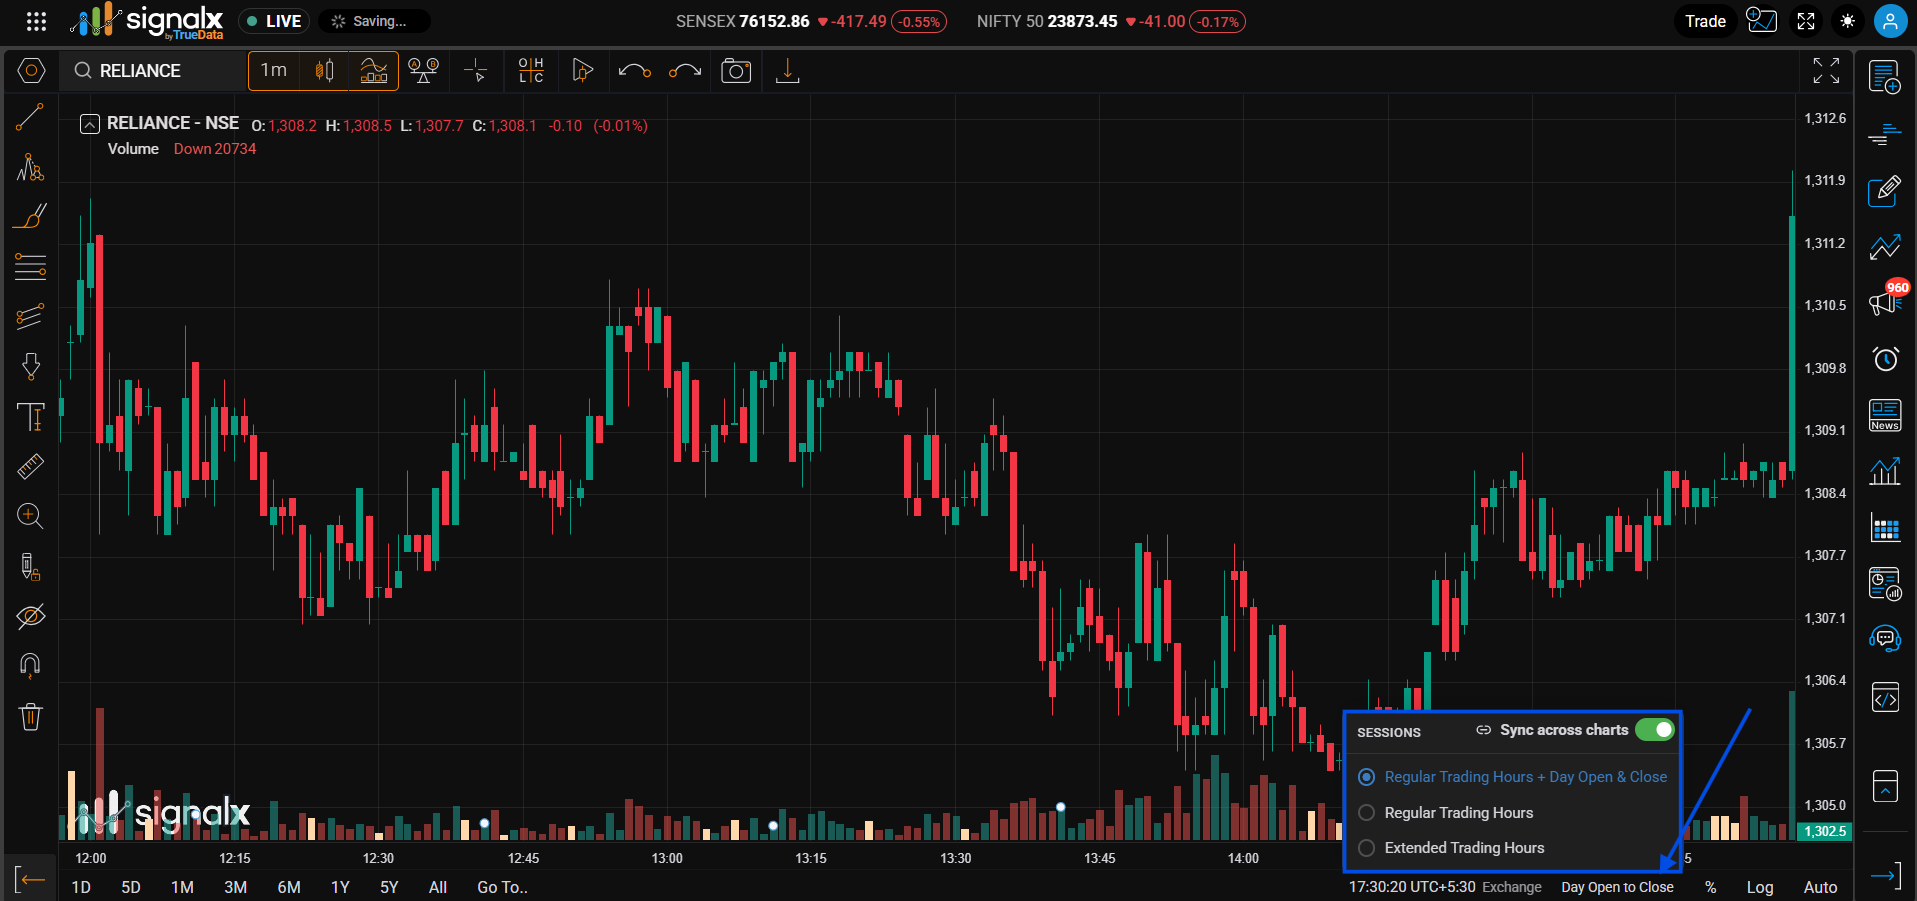
Keep session highlight settings - Regular Trading Hours + Day Open & Close, Regular Trading Hours, Extended Trading Hours - consistent across all synced panels. Change the session on any one chart and all others update to match.
How to access
Via Chart Settings only
Right-click the chart → Chart Settings → Sync Events → toggle Sync Session Across Charts → Apply. Unlike Interval, Chart Type, and Indicators, the session dropdown itself does not carry its own quick sync toggle.
Enable session sync when comparing instruments across asset classes - toggling pre-market on one chart enables it across all panels, so you never have inconsistent session views side by side.
Indicator Sync
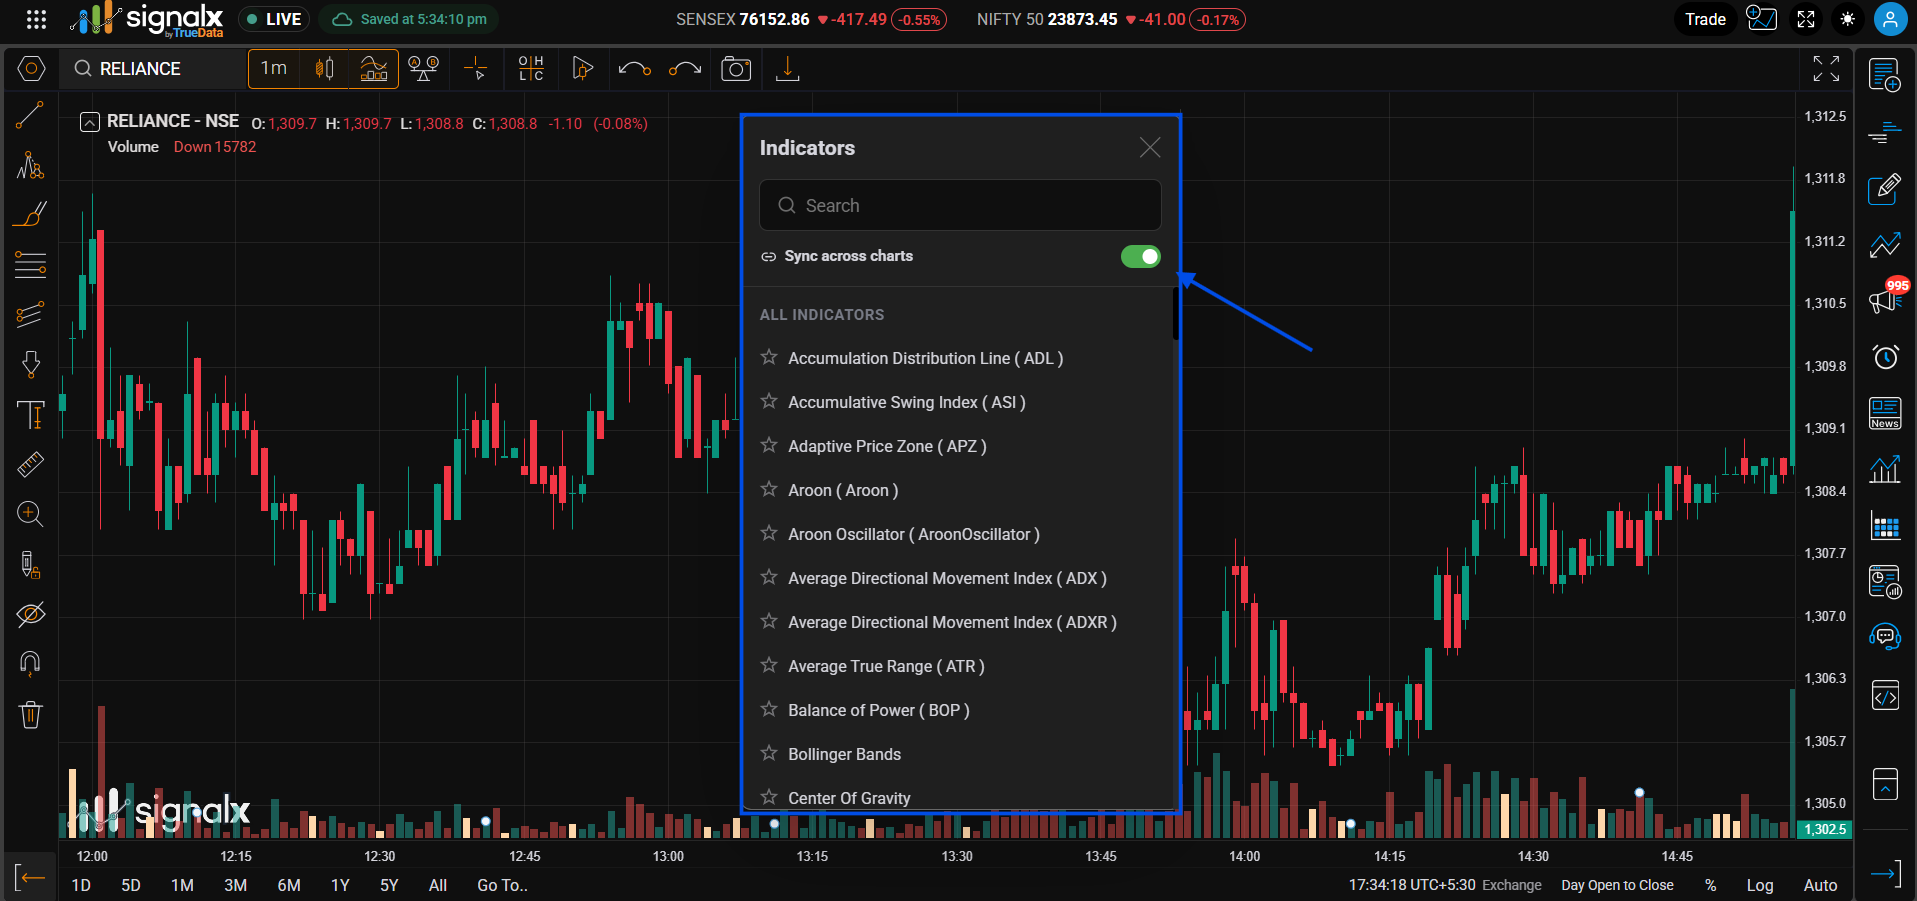
Add or remove an indicator on one synced panel - all other panels mirror the action instantly with matching parameters. No need to manually replicate your indicator setup across each chart.
How to access
Via Chart Settings
Right-click the chart → Chart Settings → Sync Events → toggle Sync Indicators Across Charts → Apply.
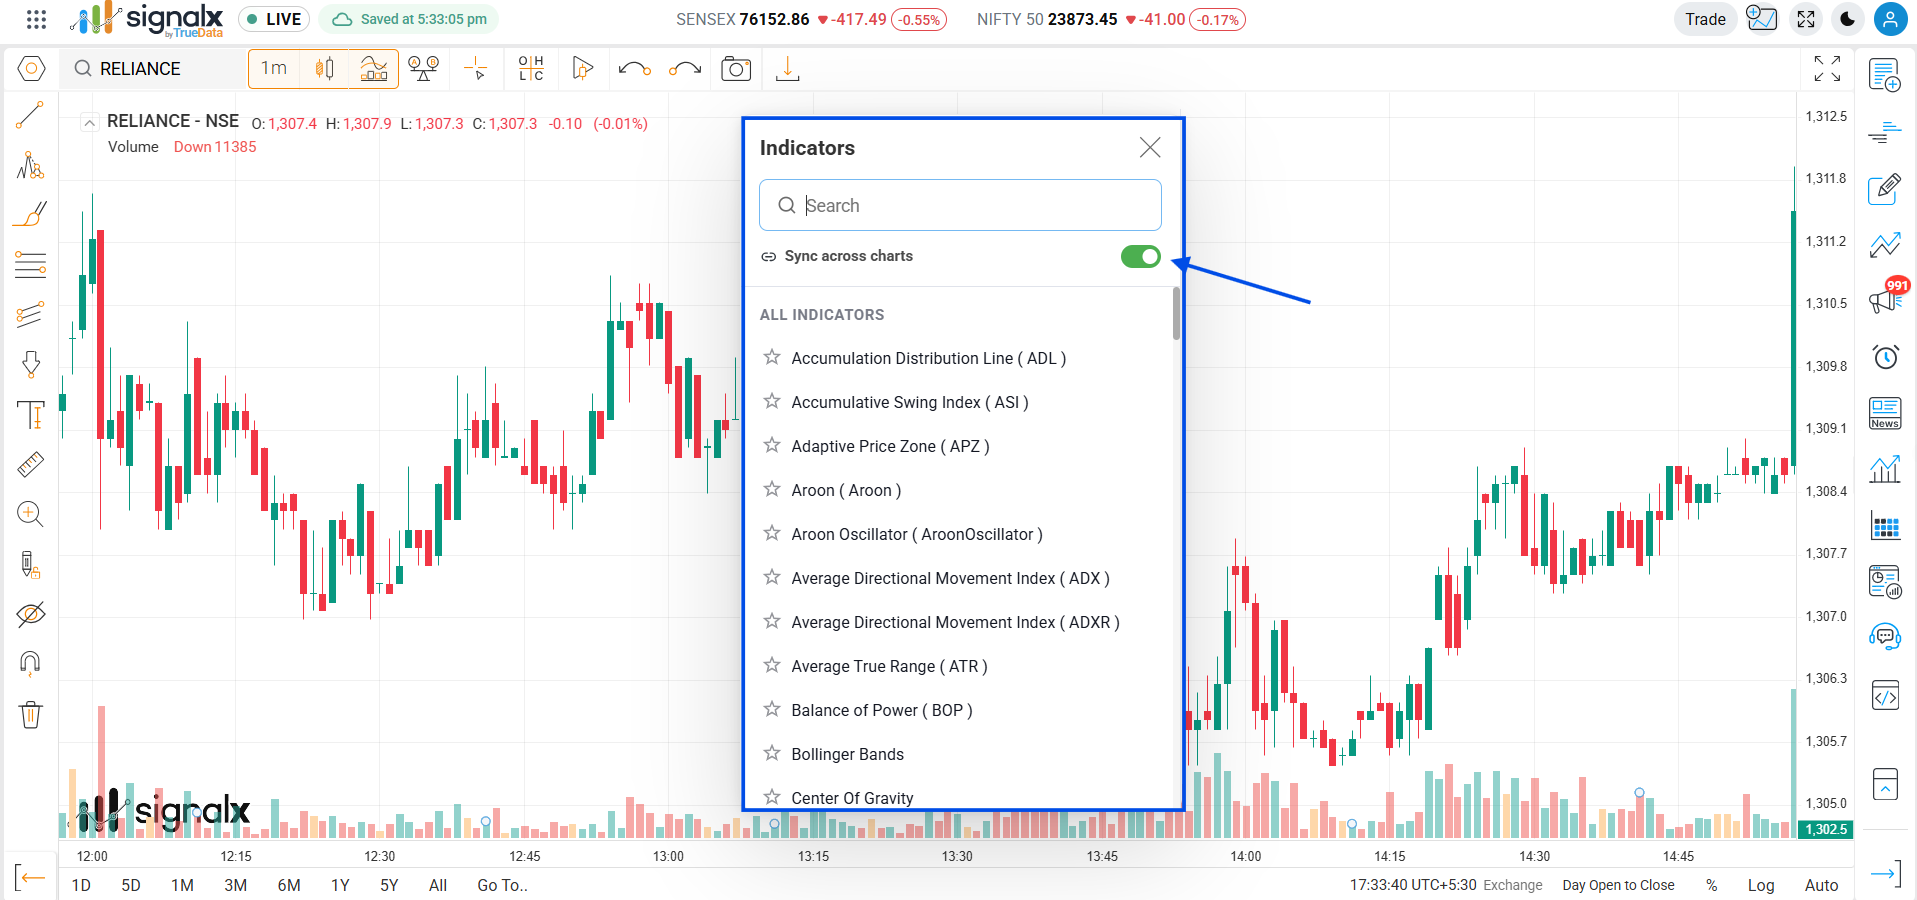
Via Indicators popup
Open the Indicators panel from the toolbar - a "Sync across charts" toggle sits just under the search bar, above the ALL INDICATORS list, so you can turn it on before adding an indicator.
Add SuperTrend on one panel with indicator sync on - every other synced panel gets it instantly with the same parameters. Adjust the period on one chart and all panels update together.