home Tools and Productivity

TS Window

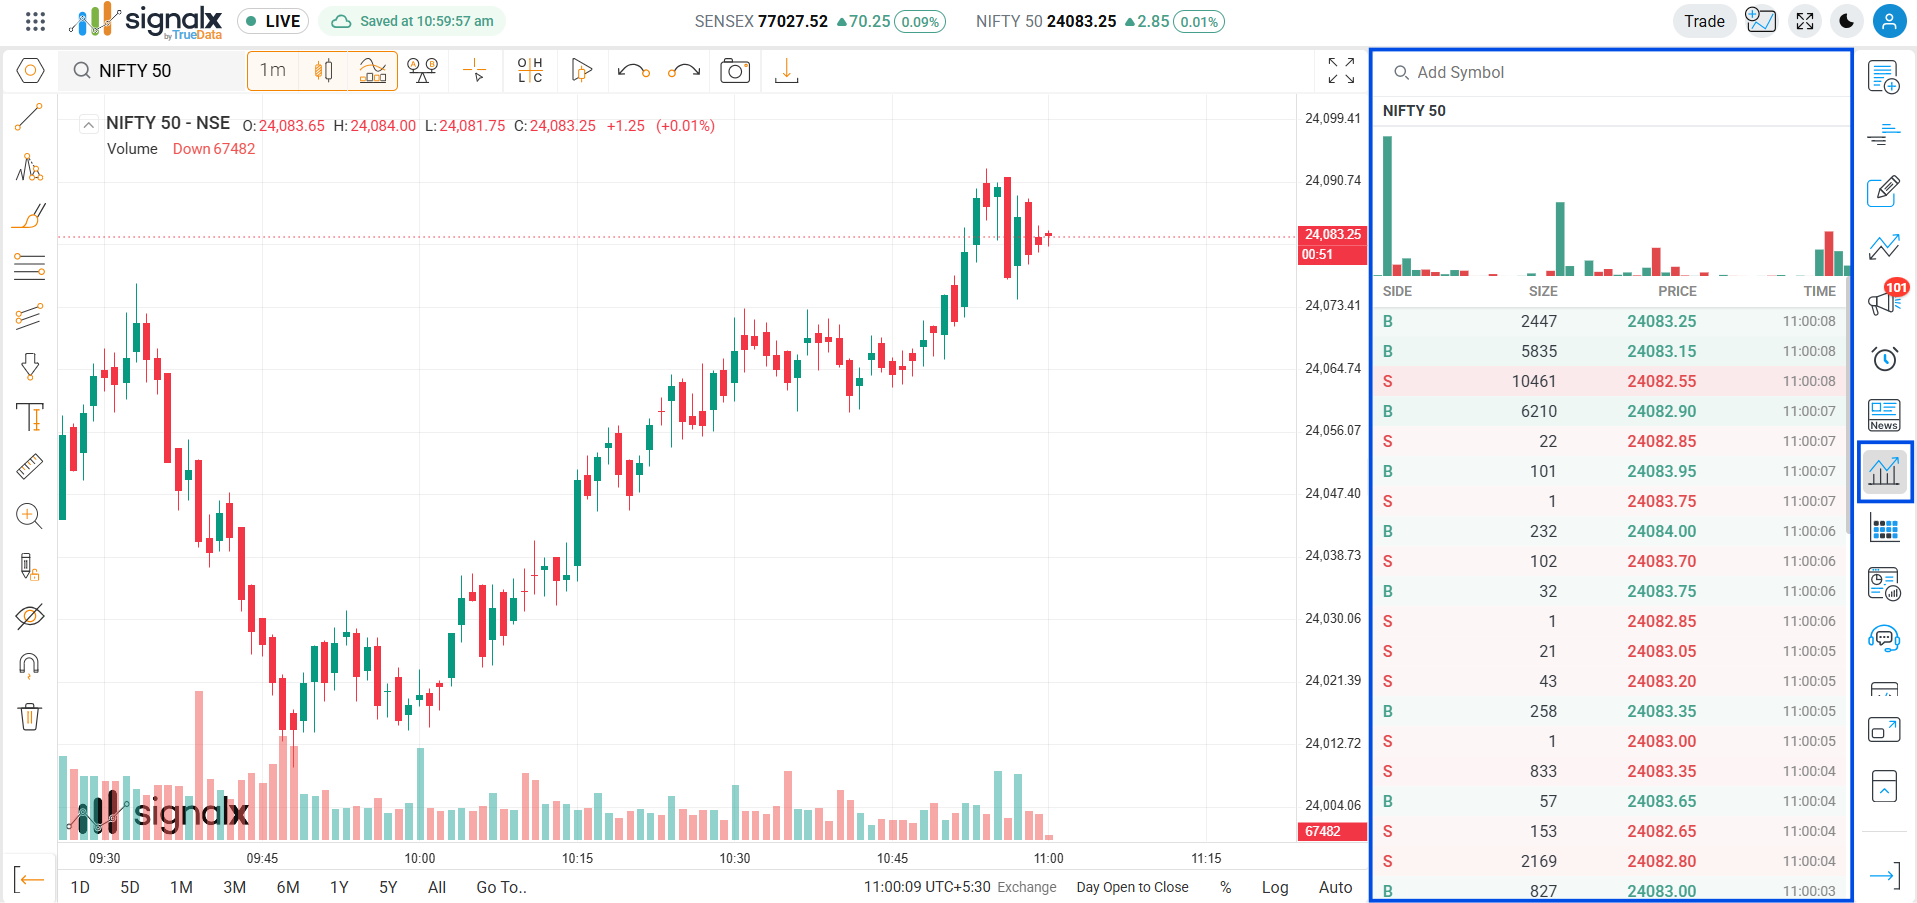
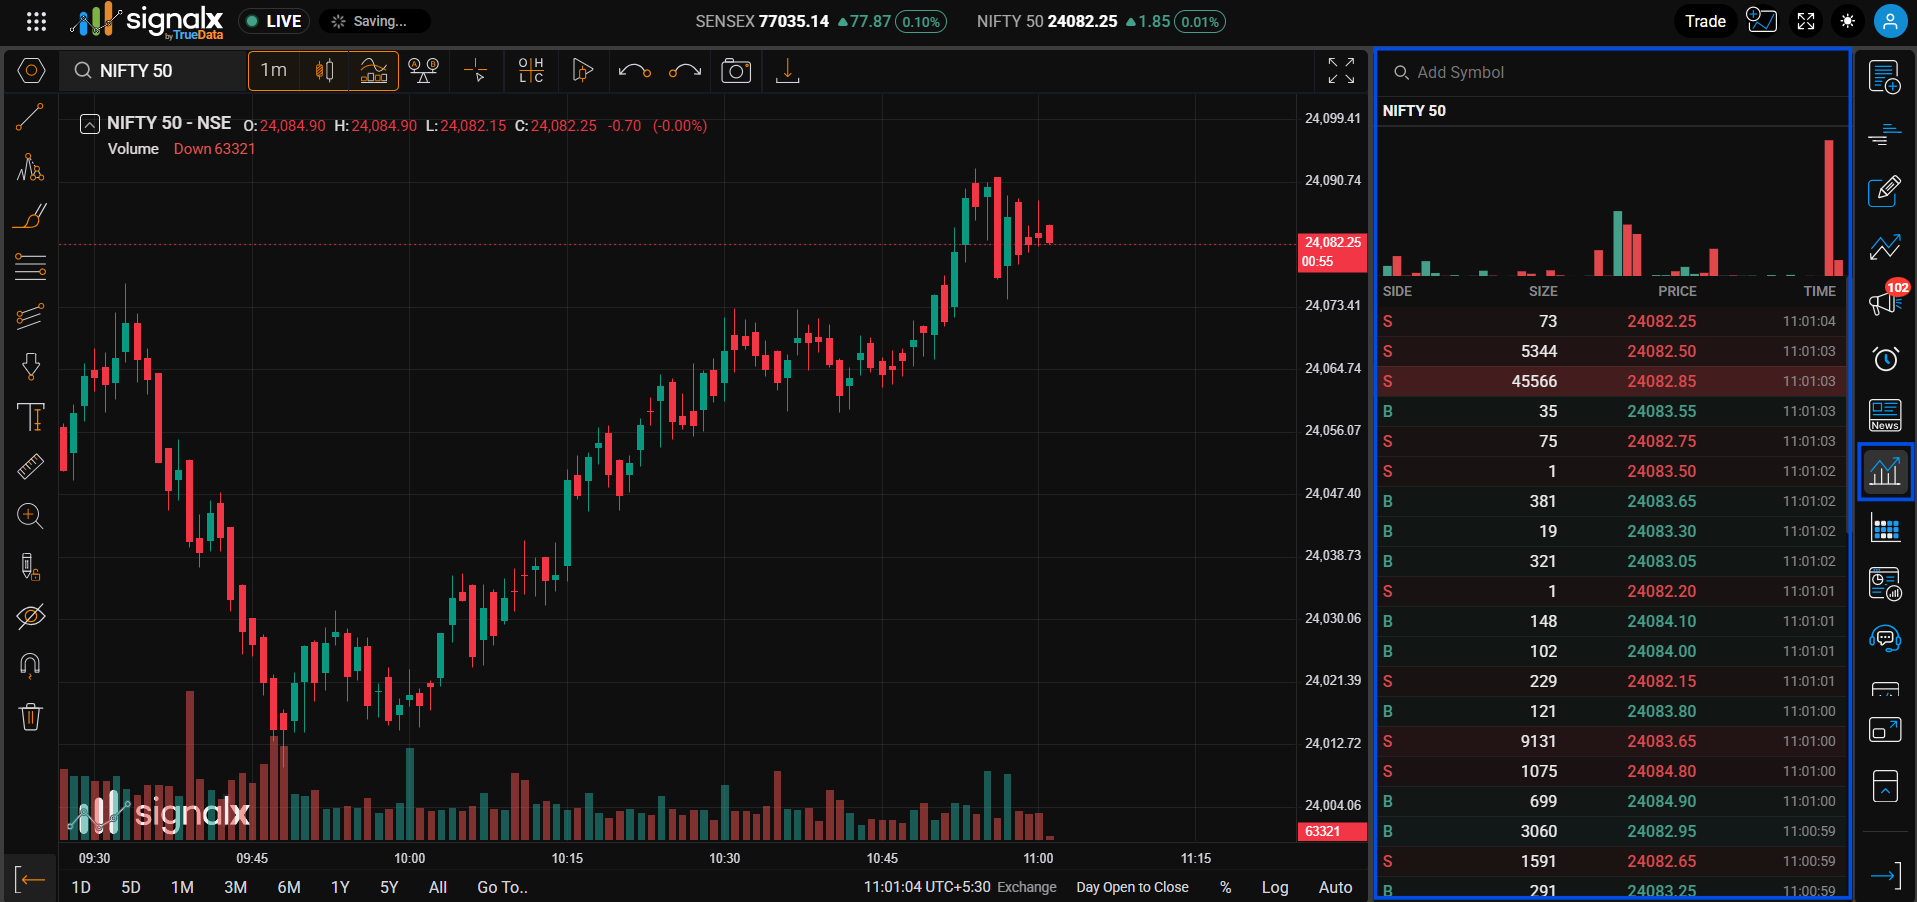
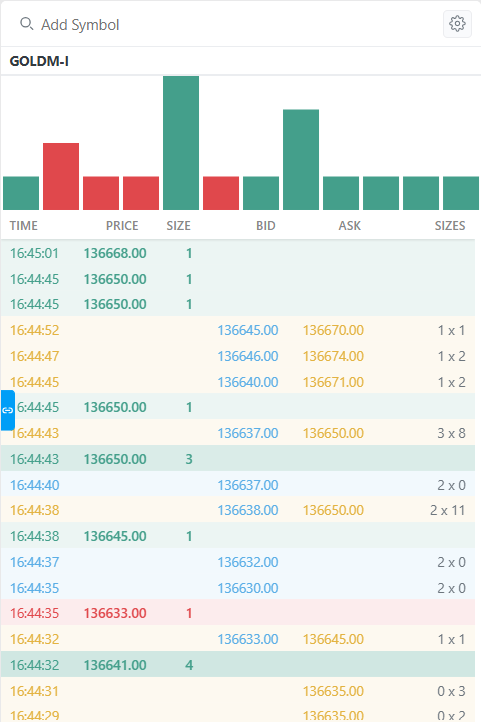
A right-panel tab that streams the live tick-by-tick feed of whatever symbol is currently plotted on the main chart - every trade prints as a new row in real time. Use the settings gear to choose what to display, the list width and the colours.
Opening the TS Window

1
Click the TS Window tab in the right panel
Find the tabs along the top of the right-side panel: Watchlist · Top Movers · Option Chain · TS Window. Click TS Window to open the live tick feed.
2
It always follows the active chart symbol
The symbol being streamed is shown at the top of the panel, just below the Add Symbol bar. Switch the chart's symbol and the tick feed underneath switches with it automatically.
3
New ticks stack at the top
Each trade appears as a new row at the top of the list and pushes older ticks down, so the most recent trade is always visible without scrolling.

TS Window Settings

Control what the feed shows, how wide the list is and which colours are used.
1
Click the settings (gear) icon
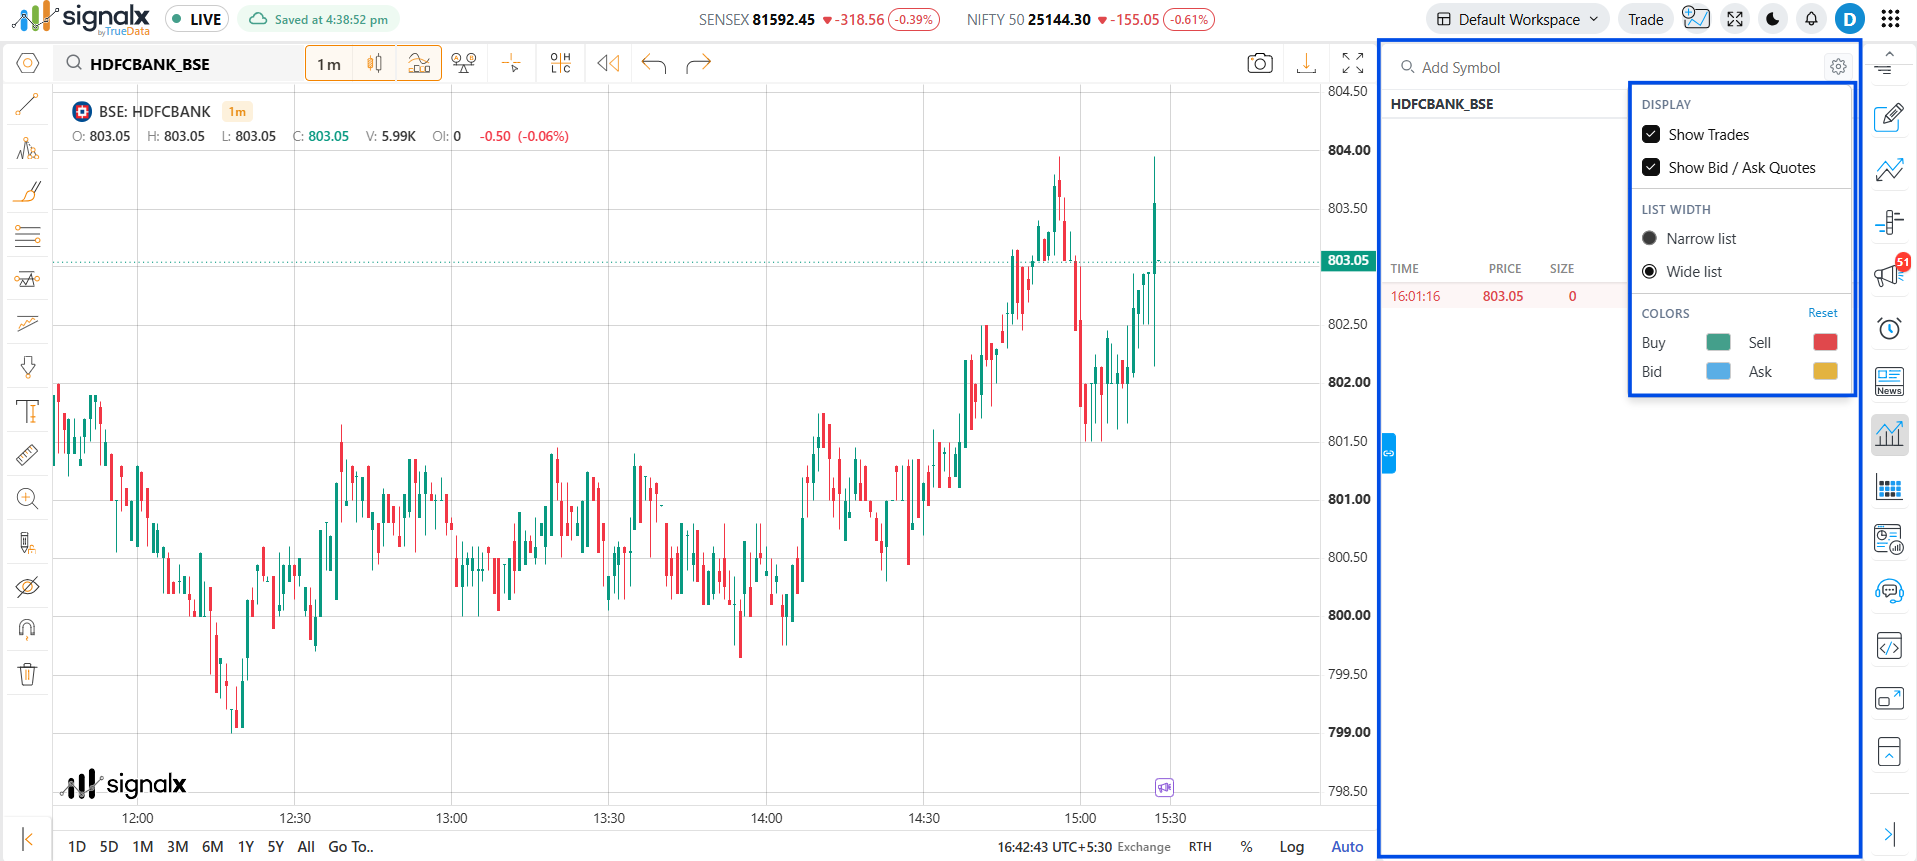
The gear icon sits at the top-right of the TS Window panel, next to the Add Symbol bar. Click it to open the settings panel.
2
Adjust Display, List Width and Colors
The panel has three groups of options - Display, List Width and Colors. Your changes are reflected in the feed straight away.
TSWindow setting panel

Display

Option · Description
Show Trades - Shows the executed trade ticks in the feed. Untick it to hide trades.
Show Bid / Ask Quotes - Shows the best bid and ask quotes in the feed alongside the trades. Untick it to hide quotes.

List Width

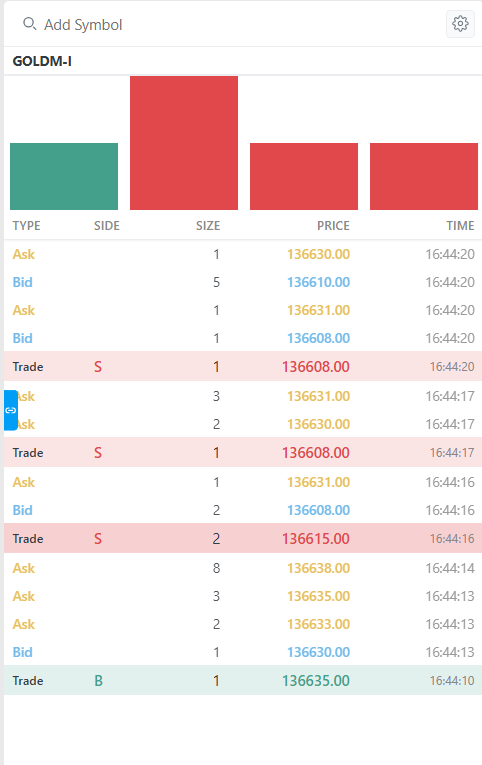
Choose how the list is laid out. Select Narrow list for a compact view that shows who traded and when, or Wide list to see trades and bid/ask quotes side by side.
TSWindow narrow list
Narrow list
A compact layout focused on the trade itself.
Type · Side · Size · Price · Time
TSWindow Wide list
Wide list
Adds the bid and ask columns next to each trade.
Time · Price · Size · Bid · Ask · Sizes

Colors

Click a colour swatch to change the colour used for that type of row. Click Reset at the top-right of the Colors group to go back to the original colours.

Buy

Buy-side trades

Sell

Sell-side trades

Bid

Bid quotes

Ask

Ask quotes

What Each Row Shows

The columns depend on the list width you choose in settings.

Narrow list · Field · Description
Type - The kind of row, for example a Trade
Side - Whether the tick printed as a buy (B) or a sell (S), colour-coded for quick scanning
Size - Traded quantity for that individual tick
Price - The exact traded price (LTP) of that tick
Time - Exact timestamp of the trade, to the second
Wide list · Field · Description
Time - Exact timestamp of the trade, to the second
Price - The exact traded price (LTP) of that tick, coloured by Buy or Sell
Size - Traded quantity for that individual tick
Bid - Best bid price, shown when Show Bid / Ask Quotes is on
Ask - Best ask price, shown when Show Bid / Ask Quotes is on
Sizes - Quantities available at the bid and ask

Why Use It

bolt

Spot large orders in real time

Unusually large Size values printing repeatedly can signal institutional activity before it shows up as a candle move.

speed

Read momentum inside a single candle

A 1-minute candle can hide dozens of ticks - TS Window shows exactly how price moved within it, row by row.

balance

Read buy/sell pressure from Side

A run of consecutive buy-side ticks (or sell-side) can reveal aggressive one-directional flow before it's visible on the chart.

timer

Time entries around expiry

On expiry day, watching raw tick flow helps gauge how fast price is moving before placing an order.

compare_arrows

Compare trades with the quotes

Switch to the Wide list and turn on Show Bid / Ask Quotes to see where trades print relative to the best bid and ask.

palette

Make the feed easy to scan

Pick your own Buy, Sell, Bid and Ask colours so each row type stands out at a glance, and use Reset to go back anytime.

tips_and_updates

Keep the TS Window tab open while scanning through your watchlist symbols on the chart - since it always follows the active chart, you get a fast tick-level read of Side, Size, and Price on each stock as you click through without switching tabs. Use the Narrow list if your right panel is tight on space.