Chart Controls
Zoom, snap, persistence and clean-up controls that make drawing on the chart faster and more precise.
Zoom Tools
Zoom into specific price and time areas on the chart for closer analysis.
Zoom
Activates zoom mode on the chart. Scroll up to zoom into a specific area and expand candle detail, or scroll down to zoom out and see a broader price range. Use this when analysing dense price action or tight consolidation zones that require a closer view.
Zoom by Area
Click and drag to draw a rectangular selection box on the chart. SignalX will instantly zoom into that exact price and time range, filling the visible chart area with the selected region. Ideal for quickly isolating a specific candle cluster, breakout zone or pattern without manually scrolling.
Shape Mode
Keep a drawing tool active continuously without reselecting after each drawing.
Persistent Drawing Mode
By default, after you complete a drawing, the chart returns to the normal cursor (pointer/crosshair mode) and you need to re-select the tool for the next drawing.
Shape Mode changes this behaviour. When enabled, the currently selected drawing tool stays active on the cursor after each drawing is completed. This means you can draw multiple lines, shapes or annotations in succession without having to click the toolbar again.
Hide Drawings
Toggle chart annotations on and off without deleting them.
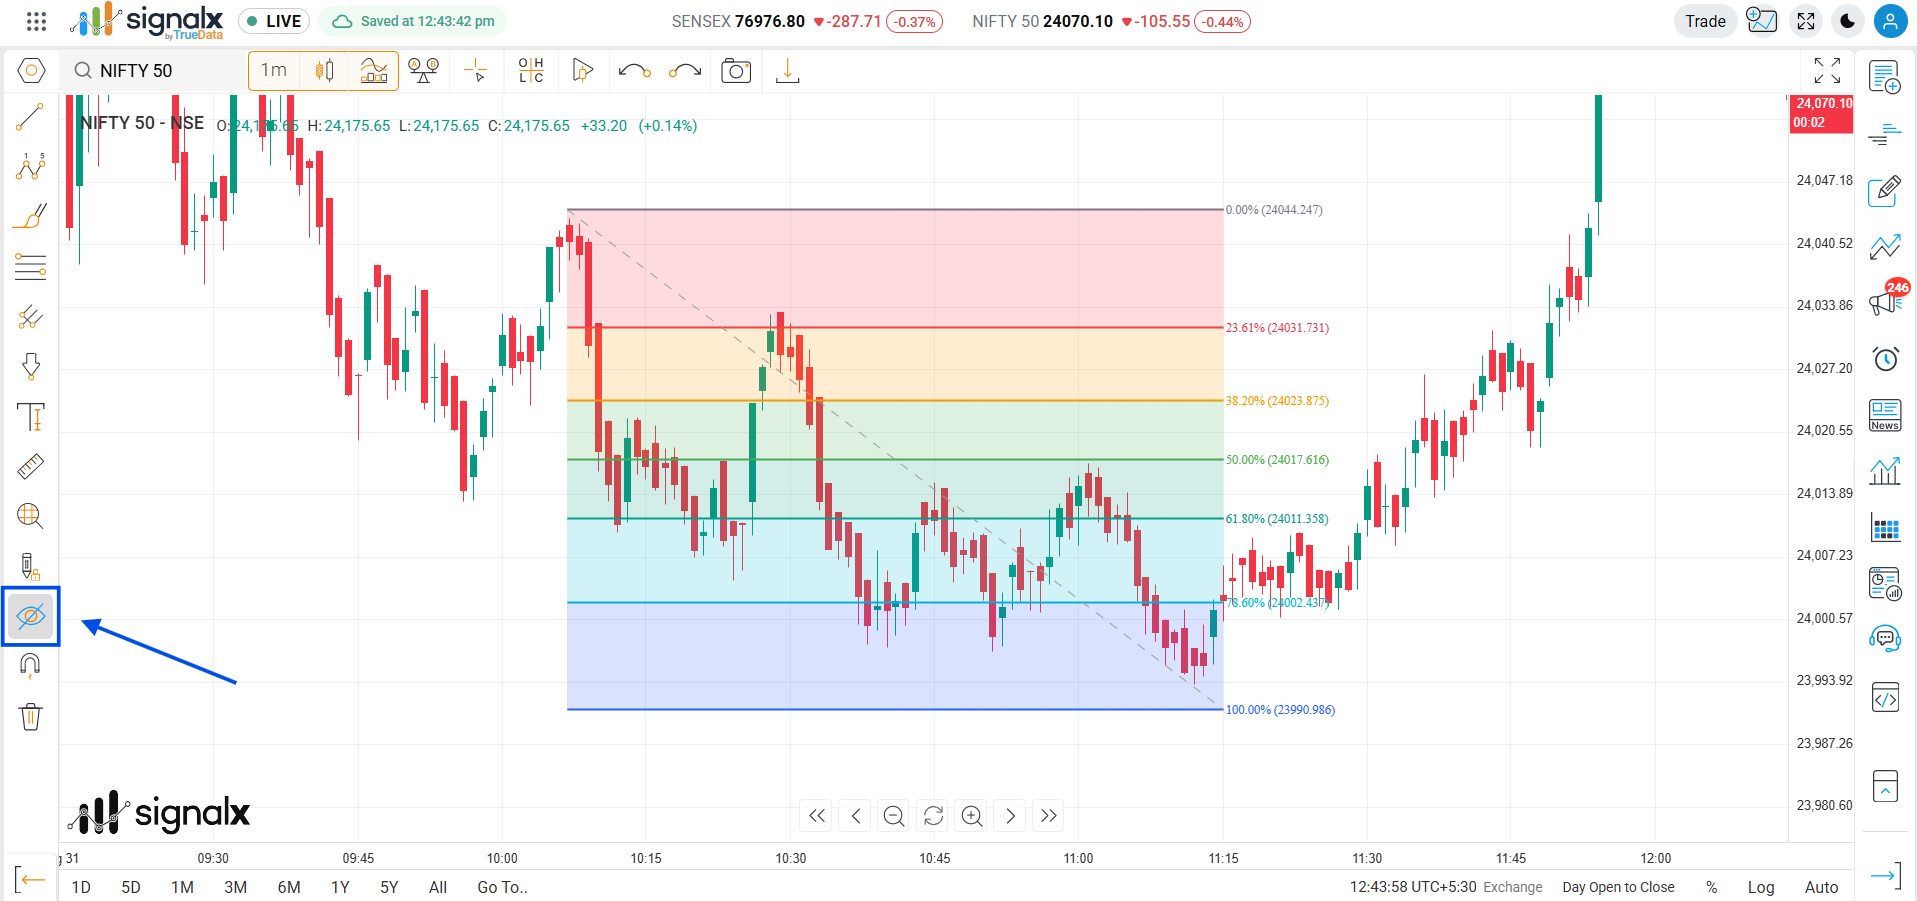
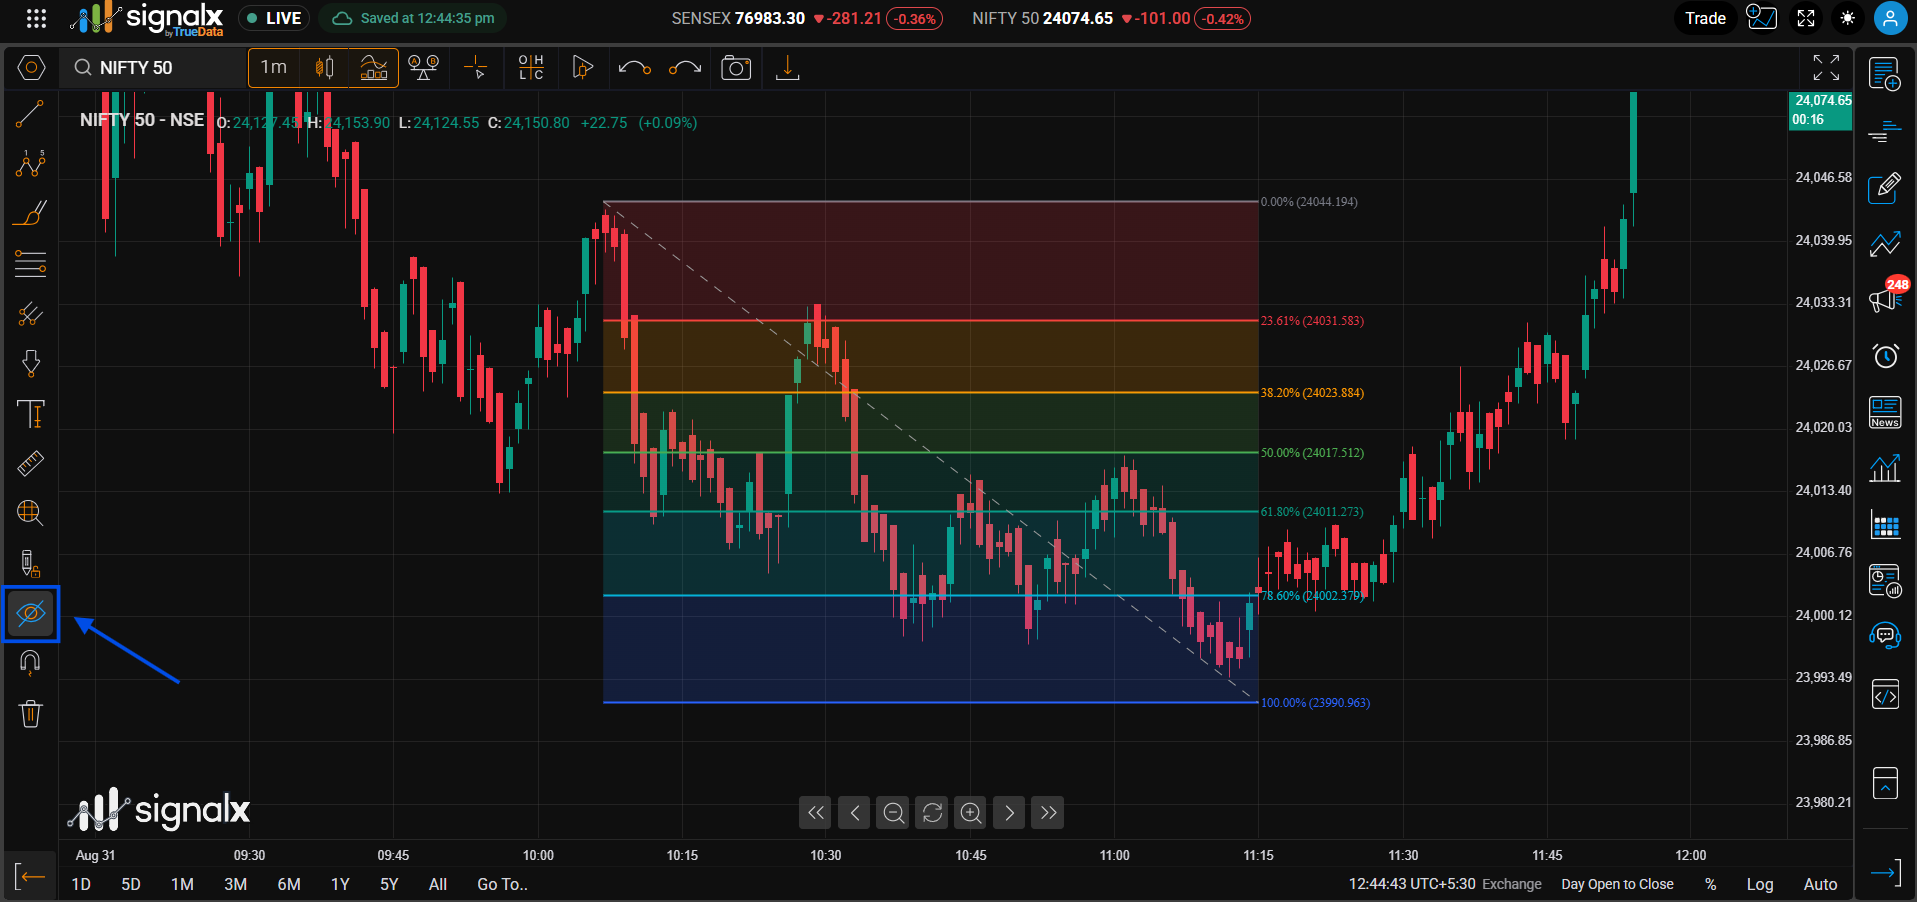
Hide / Show All Drawings
The Hide Drawings toggle lets you instantly hide all chart annotations - trendlines, shapes, Fibonacci tools, text labels and all other drawings - in one click, without deleting them.
This is useful when you want a clean, unobstructed view of the raw price action for a moment - for example, to assess overall market structure without annotation bias - and then bring all drawings back with another click. All drawings remain saved and fully intact when toggled back on.
Magnet Mode
Snap drawing anchor points precisely to OHLC price values on candles.
Strong Magnet
When Strong Magnet is active, drawing anchor points snap aggressively to the nearest OHLC price level (Open, High, Low or Close) of the closest candle - even when your cursor is some distance away from it. Use this when you need precise anchoring to exact candle extremes such as highs/lows for trendlines or Fibonacci points.
Weak Magnet
Weak Magnet applies a gentler snap - anchor points only snap to candle OHLC values when your cursor is very close to them. This gives you more freehand control while still benefiting from precision snapping when you intentionally target a candle's price level. Recommended for general drawing use.
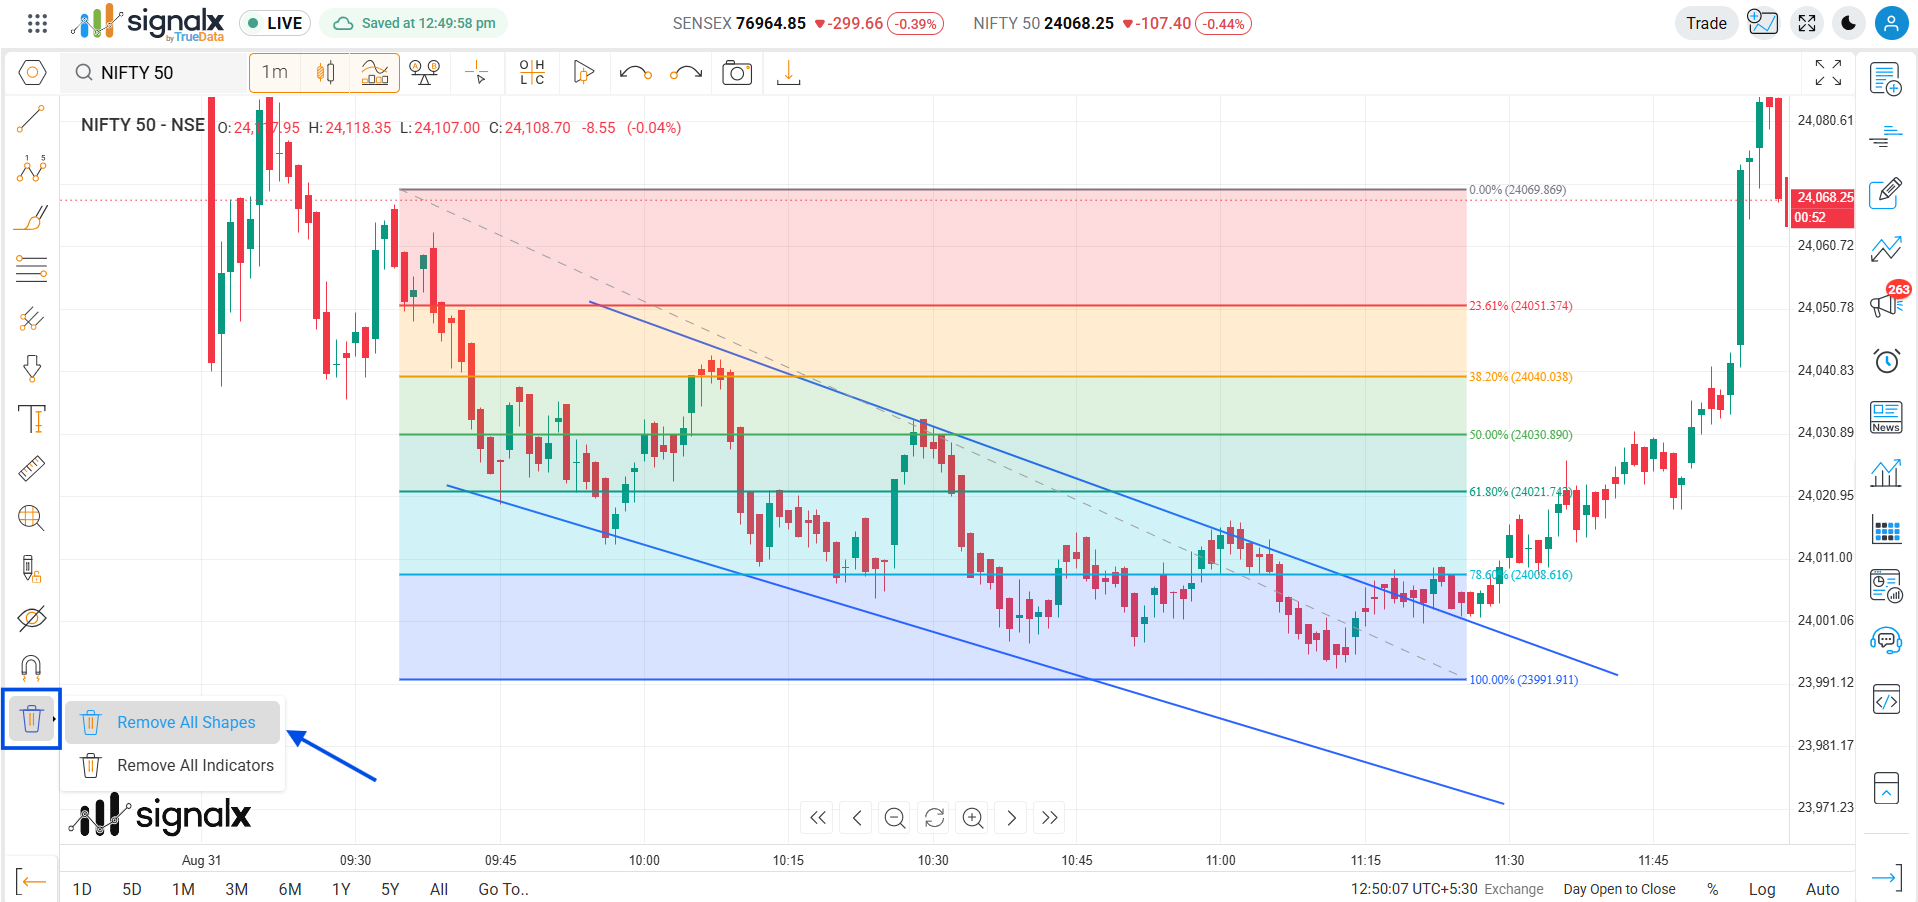
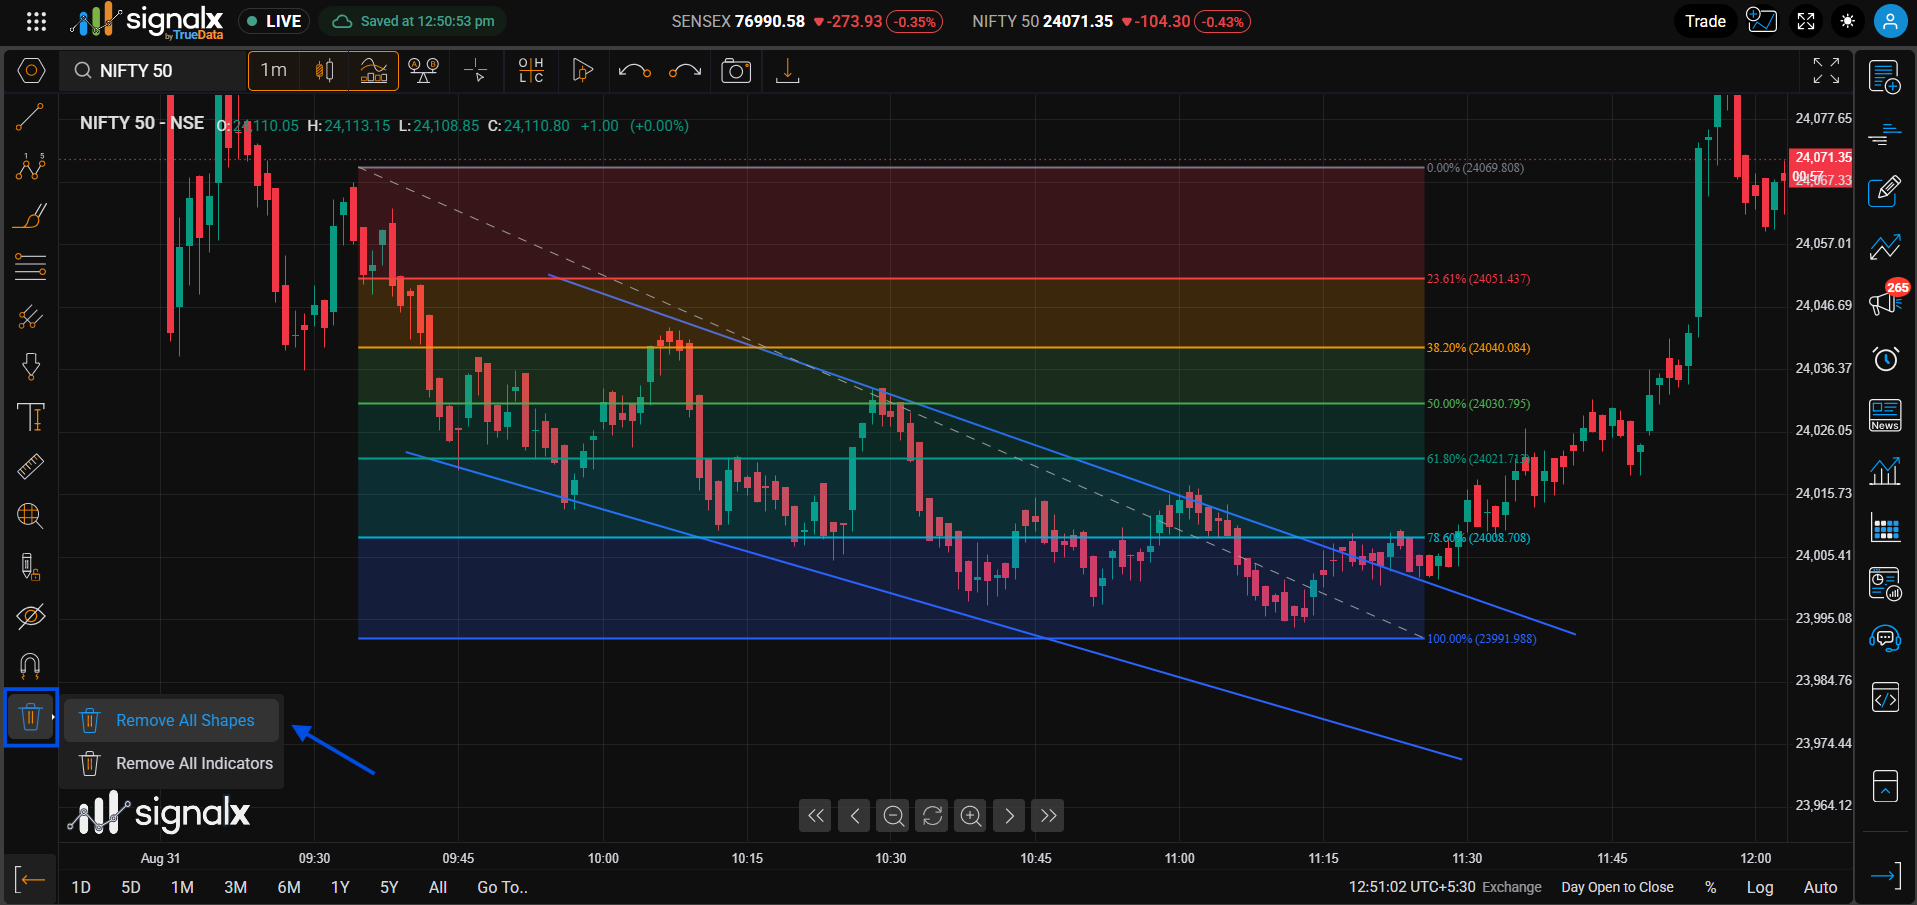
Remove All Drawings and Indicators
Clear all drawings and indicators from the chart in one action.
Clear All Drawings and Indicators
This option removes all drawings and indicators from the current chart view in a single action. This includes every trendline, shape, Fibonacci tool, text annotation, scribble, arrow and any applied indicators.