Platform Tour
A guided walkthrough of every section of the SignalX interface - what each area does, and how to use it effectively.
Top Toolbar
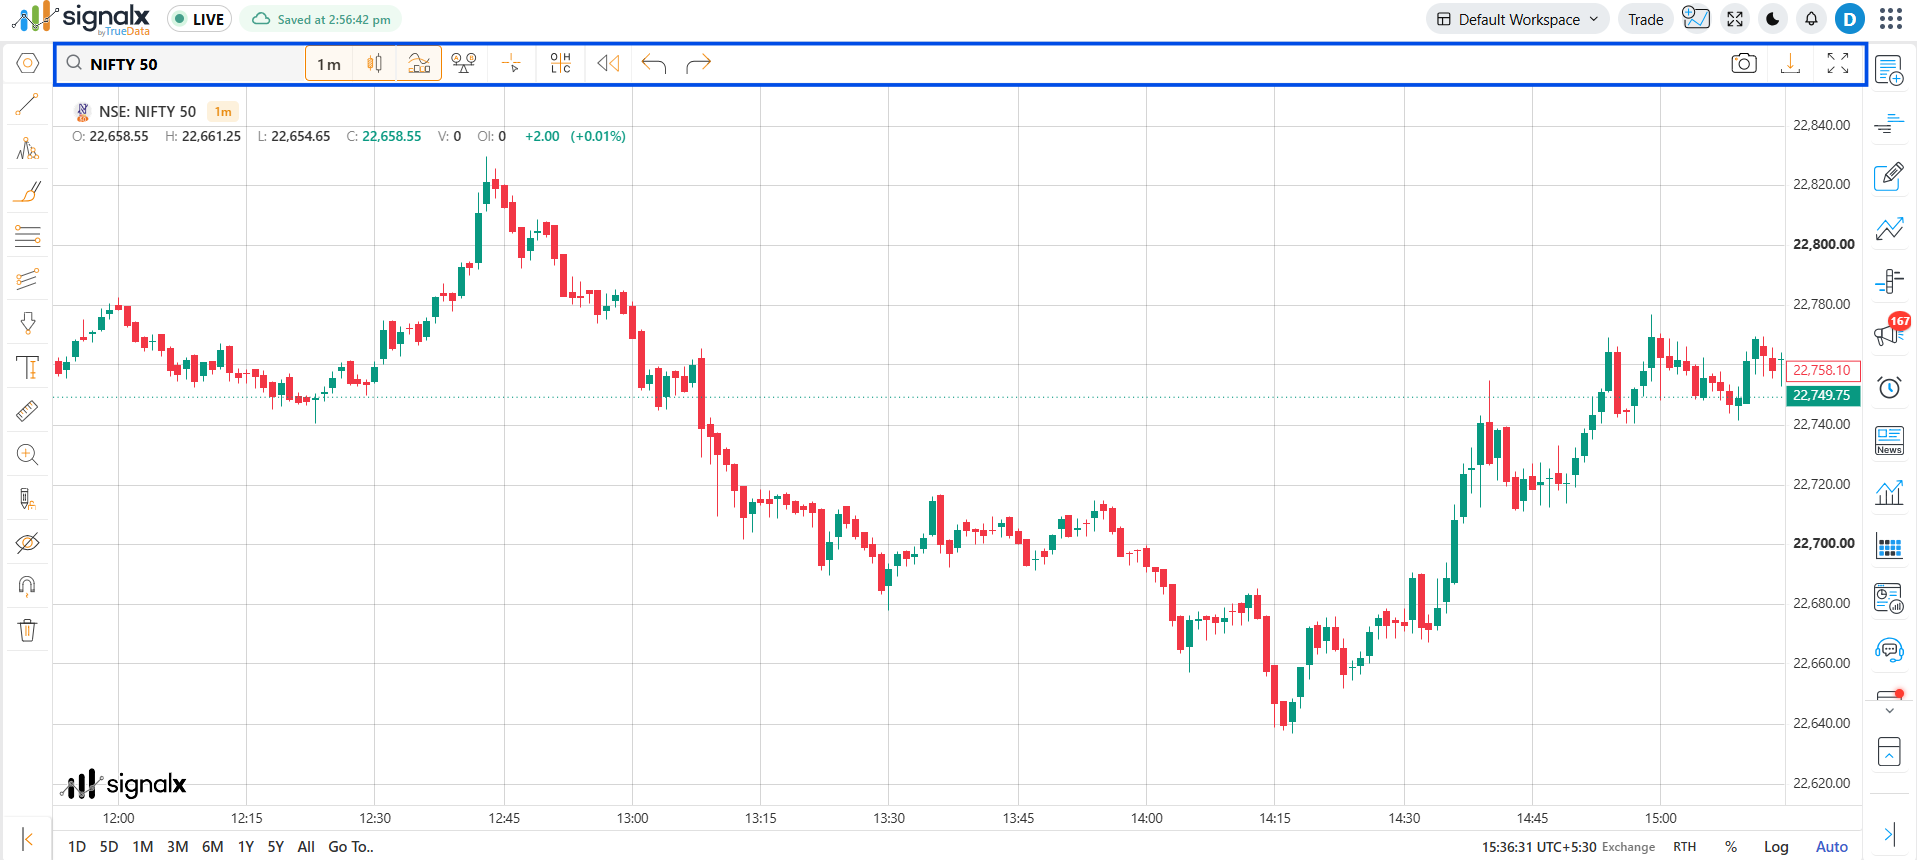
Global ControlsThe top navigation bar is your primary control strip - always visible across every session. It houses everything from symbol selection and chart configuration to session utilities like bar replay, undo/redo, and export.
Symbol Search
Click the symbol name to open search. Type any NSE/BSE equity, index, F&O contract, or currency pair to switch the active chart instantly.
Timeframe Selector
Select your candle interval - from 1 minute up to 1 Month. The timeframe applies immediately to the active chart without reloading.
Chart Type
Switch between Candlestick, Heikin-Ashi, Line, Bar, and Area chart types depending on your analysis preference.
Indicators
Opens the full indicator library. Search, apply, and configure studies like RSI, MACD, Bollinger Bands, VWAP, and more. Multiple indicators can be layered simultaneously.
Compare
Overlay a second symbol on the same chart for relative performance comparison. Useful for comparing a stock vs its sector index.
Cursor Options
Toggle between default pointer, crosshair, dot cursor, and arrow cursor. Crosshair mode shows exact OHLC values as you hover across the chart.
OHLC Panel
Enable to see Open, High, Low, Close, and Volume details for any candle - hover your cursor over a point on the chart and the values pop up instantly.
Bar Replay
Replay historical price action candle-by-candle at your chosen speed. Great for backtesting entries and exits without using a separate tool.
Undo / Redo
Step backward or forward through drawing actions. Accidentally deleted a trendline? Undo brings it right back.
Save as Image
Captures a clean screenshot of the current chart view - including drawings and indicators - and saves it as a PNG to your device.
Export
Export the chart's underlying OHLCV data as a CSV file for use in spreadsheets, backtesting tools, or custom analysis.
Use Bar Replay after-market to practice reading price action on any past session - it's the fastest way to build pattern recognition.
Chart Area
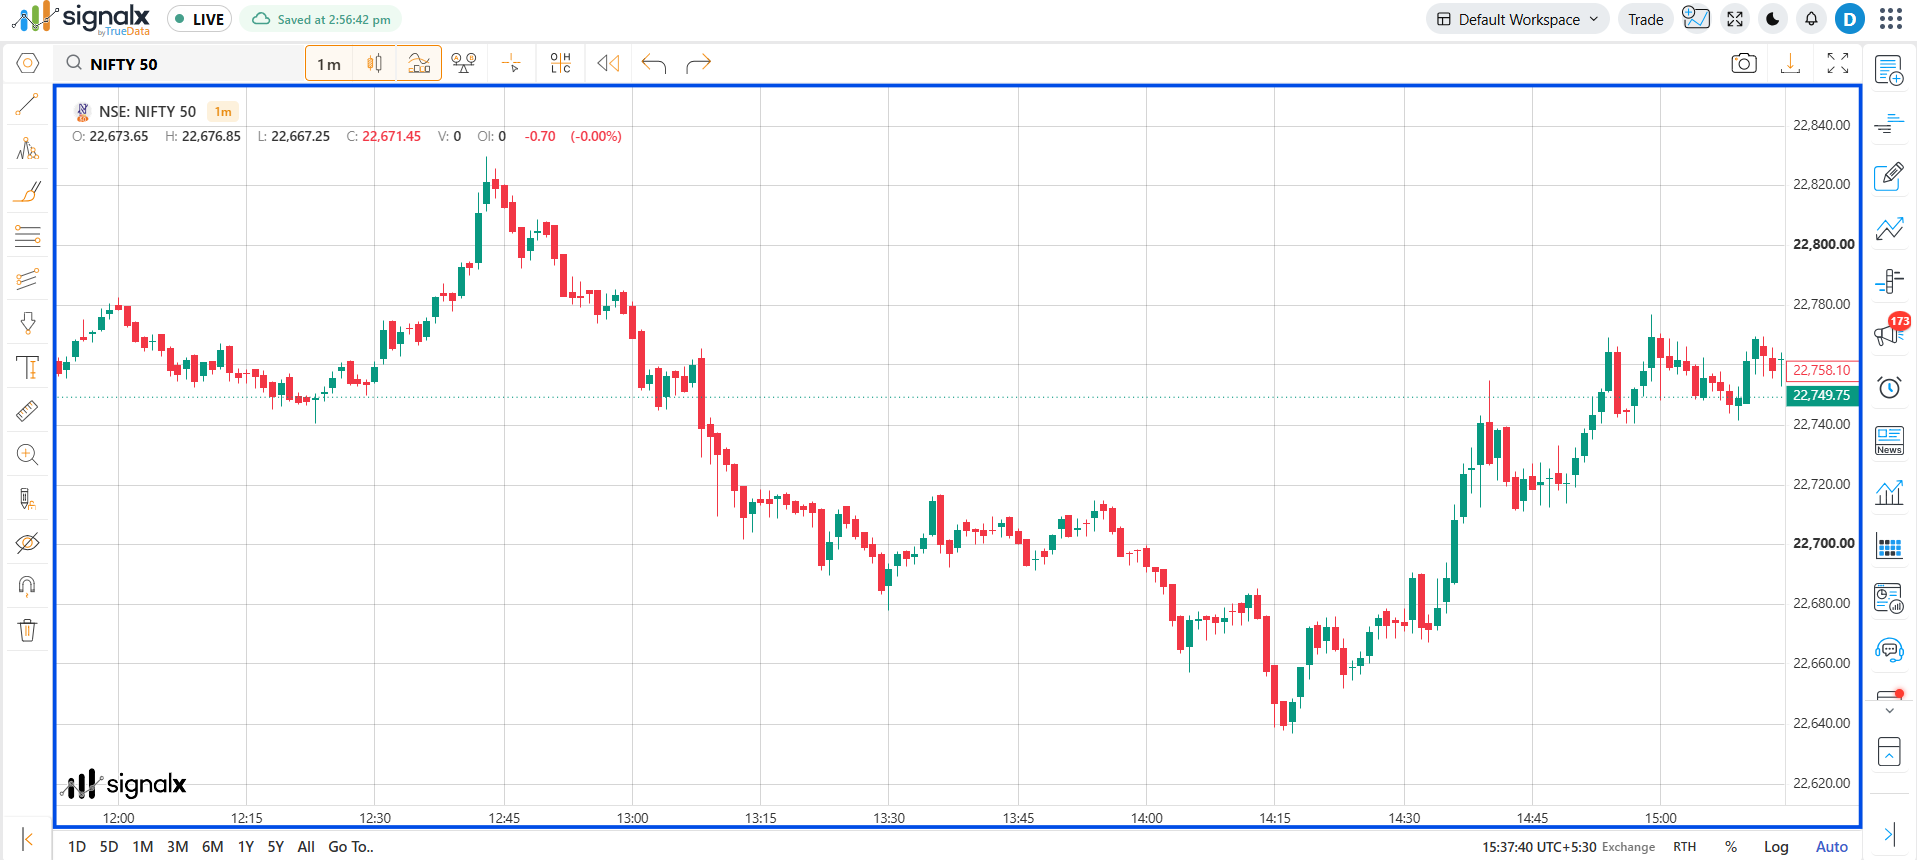
Core ViewThe chart area is the central canvas of SignalX. It renders live and historical price action for your selected symbol and timeframe, and hosts all your drawings, indicators, and analysis overlays.
Price Action Rendering
Displays candles, bars, or line charts with smooth real-time updates during market hours. Scroll back to load historical data automatically.
Indicator Panels
Oscillators like RSI, MACD, and Stochastic render in separate resizable sub-panels below the main chart. Overlay indicators like EMA and VWAP plot directly on price.
Drawing Overlay
All tools from the left panel - trendlines, Fibonacci, shapes, text - are drawn and rendered live on this canvas.
Zoom & Pan
Scroll to zoom in or out on the time axis. Click and drag to pan left or right through price history without losing your drawings.
Right-Click Menu
Right-click anywhere on the chart to access quick actions: Add Alert at price, Insert text, Measure a range, or manage existing drawings.
Pinch-zoom on trackpad or use Ctrl + Scroll to zoom the price axis vertically and focus on a tighter price range.
Drawing Tools
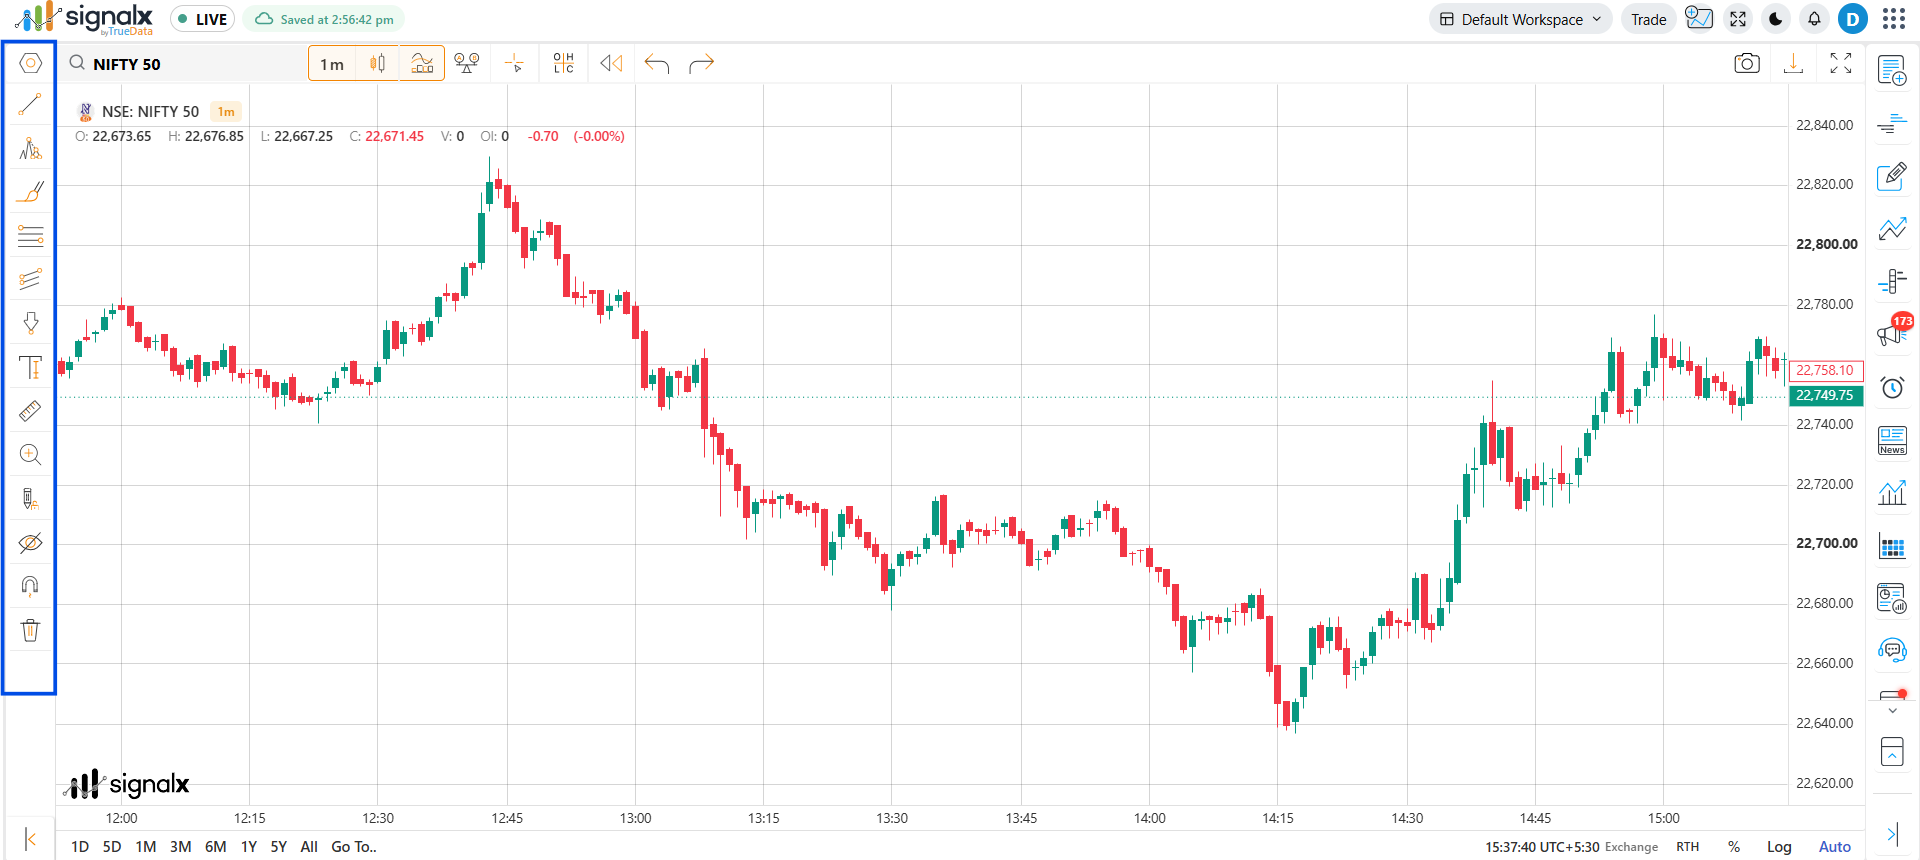
Drawing ToolsThe vertical toolbar on the left side contains the complete set of drawing and annotation tools. All tools work directly on the chart canvas and support colour, style, and visibility customisation.
Trend Lines
Draw segment, ray, or extended trendlines between two price points. Supports angled, horizontal, and vertical orientations.
Scribble
Freehand draw directly on the chart to circle patterns, sketch structure, or mark up price action by hand.
Fibonacci Tools
Drag from swing low to swing high to auto-plot Fibonacci retracement and extension levels with customisable colours.
Trend Channel
Plot a parallel channel around price action to visualise the upper and lower bounds of a trending move.
Shapes
Draw rectangles, ellipses, and triangles to highlight chart zones, consolidation ranges, or pattern structures.
Arrows & Markers
Place directional arrows (up, down, left, right) or markers - dot, square, diamond, node - to flag entries, exits, or points of interest.
Text
Add sticky text labels anywhere on the chart to annotate trade setups, mark levels, or leave study notes.
Measure
Drag across a price range or candle span to measure the exact point move, percentage change, and number of bars covered.
Zoom
Zoom in or out on the chart, or use Zoom by Area to drag-select a specific region and zoom directly into it.
Hide Drawings
Temporarily hide all drawings on the chart with a single click, without deleting them - toggle back on anytime.
Magnet Mode
Controls how strongly your cursor pulls toward candles while you're drawing. Weak Magnet gives a light pull toward nearby candles, while Strong Magnet locks the line firmly onto candle points as you draw.
Remove Selected Shape
Delete the currently selected drawing, or use Remove All Shapes / Remove All Indicators to clear the chart in one click.
Press Escape at any time to exit the active drawing tool and switch back to cursor/select mode.
Watchlist Panel
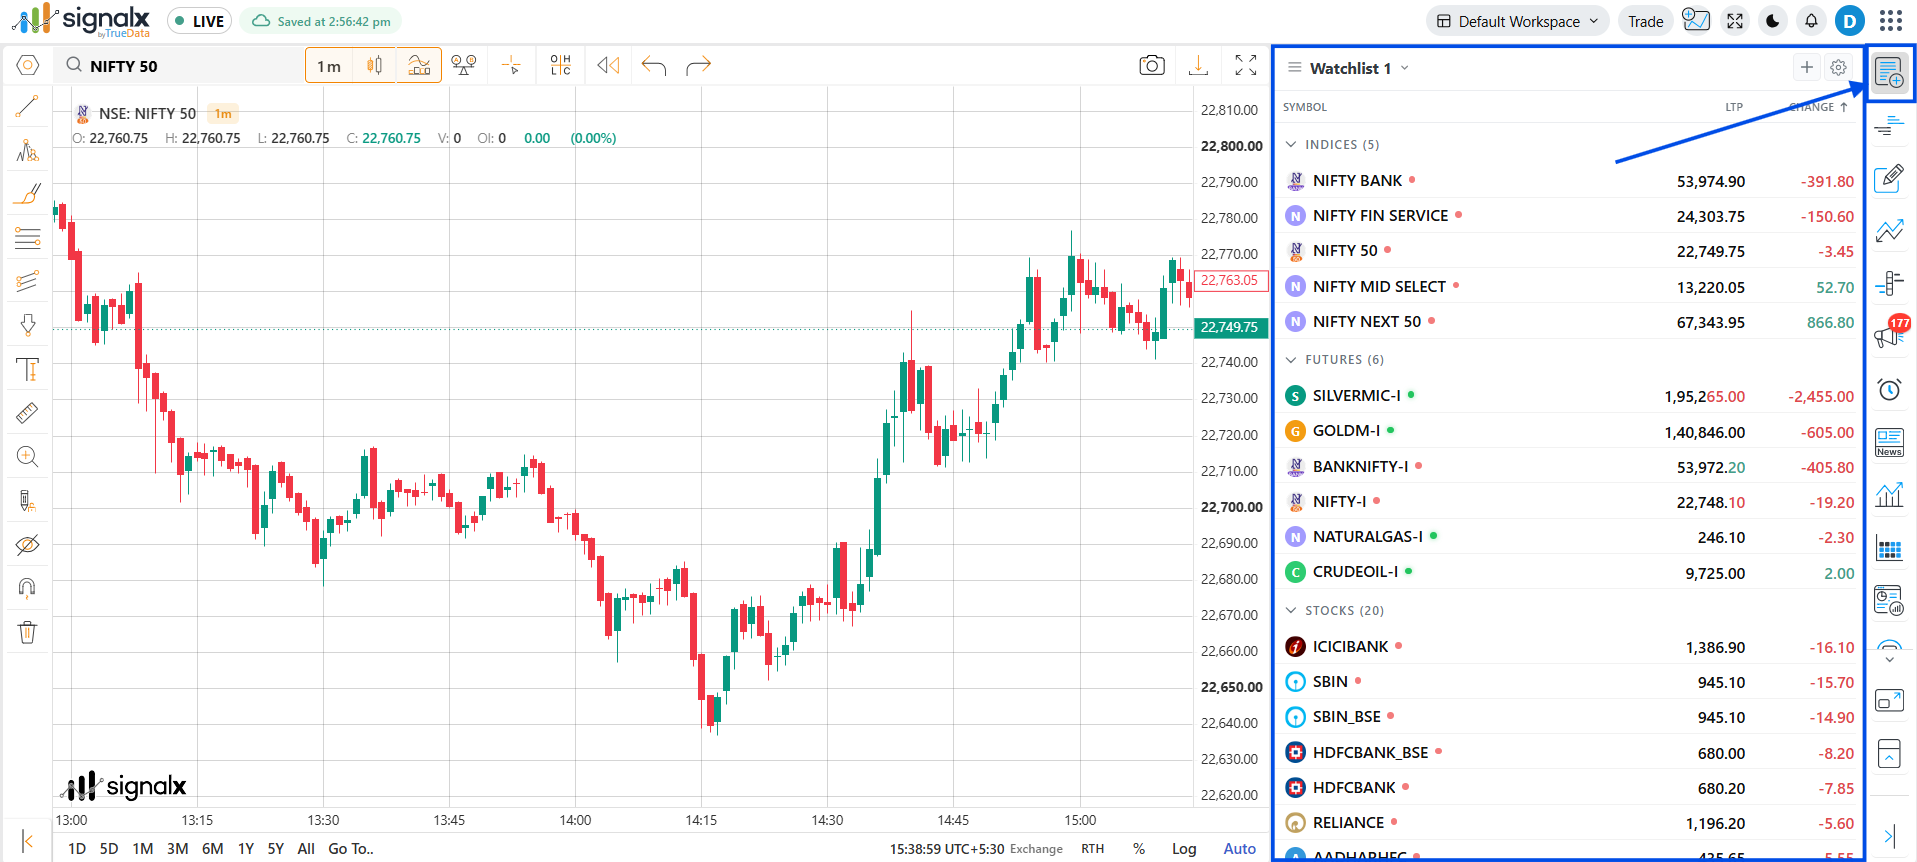
Symbol ManagementThe right panel is your symbol hub. Create and manage watchlists, monitor live prices, and load any symbol onto the chart with a single click - or by dragging it directly onto the canvas.
Live Price Feed
Each row displays LTP, absolute change, and percentage change, updated tick-by-tick during market hours.
Grouped by Segment
Symbols are automatically grouped under collapsible headers - Indices, Futures, Stocks, and more - each showing a live symbol count.
Customisable Columns
Open the gear icon's Columns tab to add or remove data points - Price & Changes (Open, High, Low, P Close, ATP, SparkLine), Volume & Activity (Total Volume, Tick Volume, Turnover, Timestamp), Open Interest (OI, OI Change, OI Change %, OI Prev Close), and Order Book (Bid, Ask, Bid Qty, Ask Qty).
Display Settings
The gear icon's General tab lets you toggle Group Headers, Table View (gridlines), and Detail Pane (an inline symbol chart), plus choose a Flash Mode - Digit Flash, Background, or None - for price updates. A Reset Watchlist option is also available here.
Multiple Watchlists
Click the watchlist name dropdown to switch between saved watchlists, each showing its symbol count. Rename or delete any watchlist inline, or use 'Create New' to add another.
Add Symbols
Use the search bar inside the panel to add any NSE/BSE equity, index, F&O contract, or currency pair to the active watchlist.
Click to Load Chart
Click any symbol row to instantly load it onto the main chart area. The current timeframe and drawings are preserved.
Drag onto Chart
Drag any symbol from the watchlist and drop it directly onto the chart canvas to load that symbol - fast and intuitive, especially with a multi-monitor setup.
Reorder Symbols
Drag symbol rows up or down within the watchlist to reorder them. Your custom order is saved automatically.
Drag a symbol from your watchlist onto the chart to load it without interrupting your keyboard or mouse workflow.
Multi-Chart Layout
Chart LayoutMultichart lets you view multiple symbols or timeframes side-by-side in a single workspace. Split the screen into 2, 4, or 6 chart panels - each fully independent with its own symbol, timeframe, indicators, and drawings.
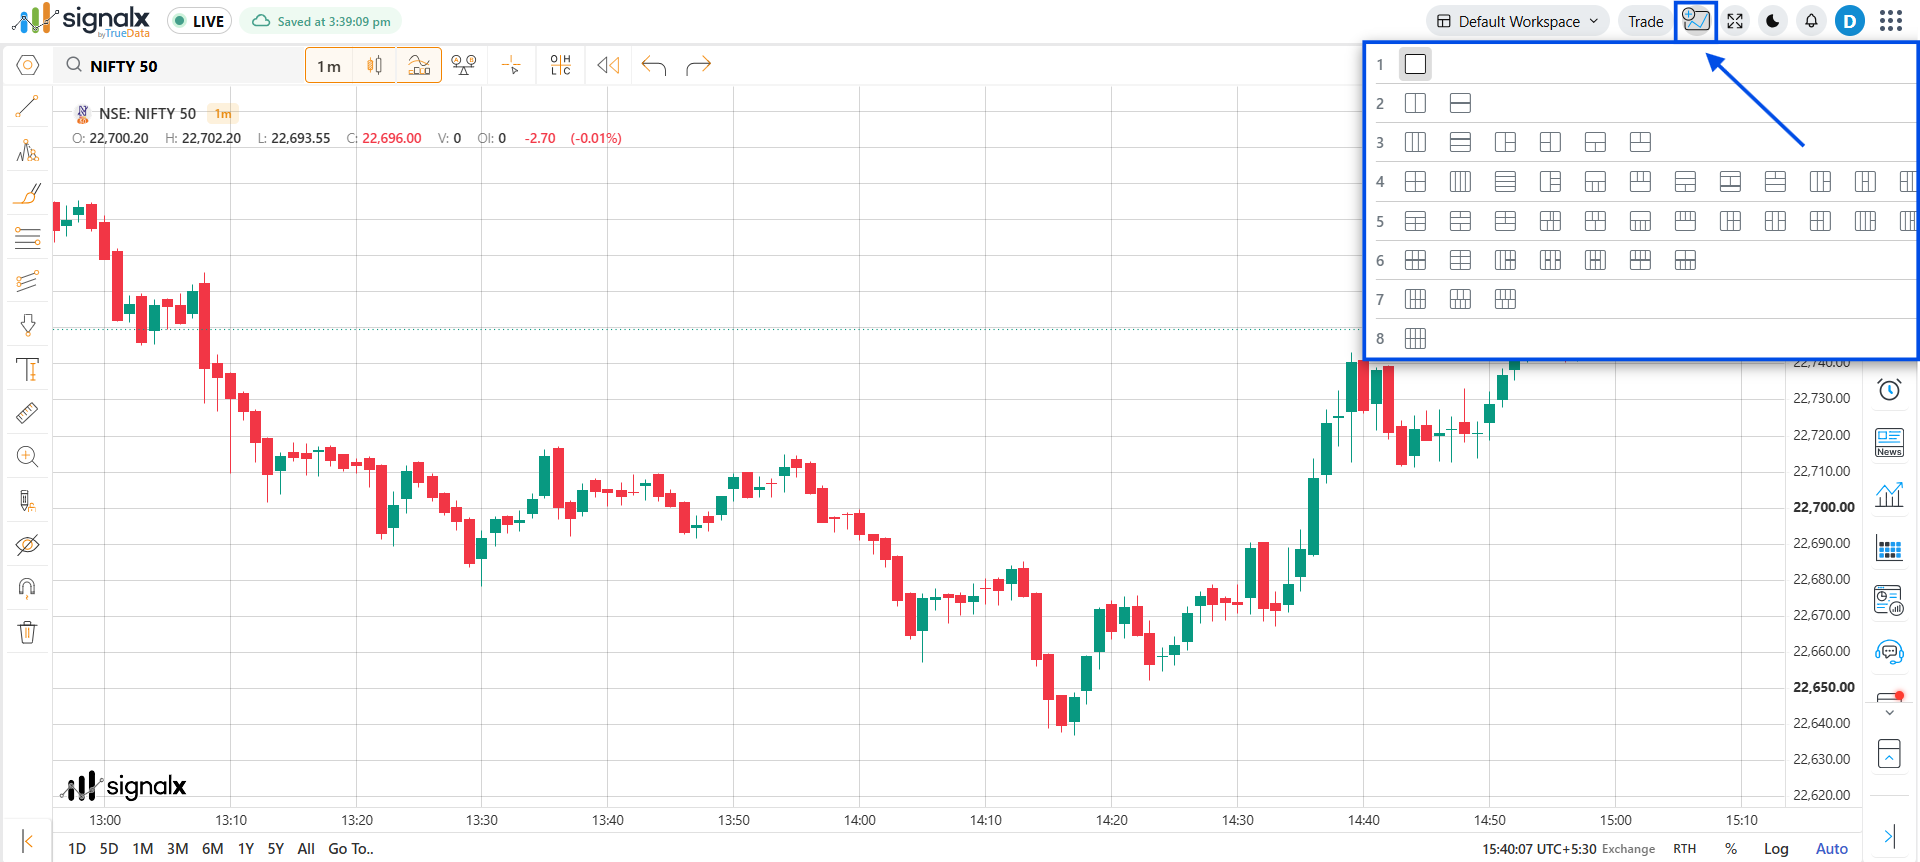
Layout Selector
Choose from 1 up to 8 panels using the grid icon in the top bar - each panel count offers several split arrangements (rows, columns, and mixed grids) to pick from, not just a single fixed layout.
Independent Panels
Each panel has its own symbol, timeframe, chart type, indicators, and drawings, so changes in one panel don't affect the others - unless Sync Mode is turned on, in which case timeframe and crosshair changes apply across all panels together.
Drag & Resize Panels
Drag a panel's border to resize it relative to its neighbours, letting you give more screen space to the chart you're focused on within any layout.
Sync Mode
Enable Sync to lock all panels to the same timeframe and crosshair position. Useful for multi-timeframe analysis on the same symbol.
Drag from Watchlist
Drag any symbol from the right watchlist panel and drop it into any chart panel to load it instantly.
Autosave Layout
With autosave turned on, your multichart workspace - panel layout, symbols, and settings - saves automatically as you work, so it's restored exactly as you left it next session.
Use the 2×2 layout for multi-timeframe analysis - e.g. NIFTY on 15m, 1h, 1D, and BankNIFTY on 15m all visible at once.
Option Chain
DerivativesThe Option Chain opens from the 2nd icon in the right-side icon rail, docking as a panel next to the chart first. It shows live strike-wise Call and Put data for NIFTY, BANKNIFTY, and all F&O stocks - including OI, IV, Greeks, LTP, and volume - without leaving the chart.
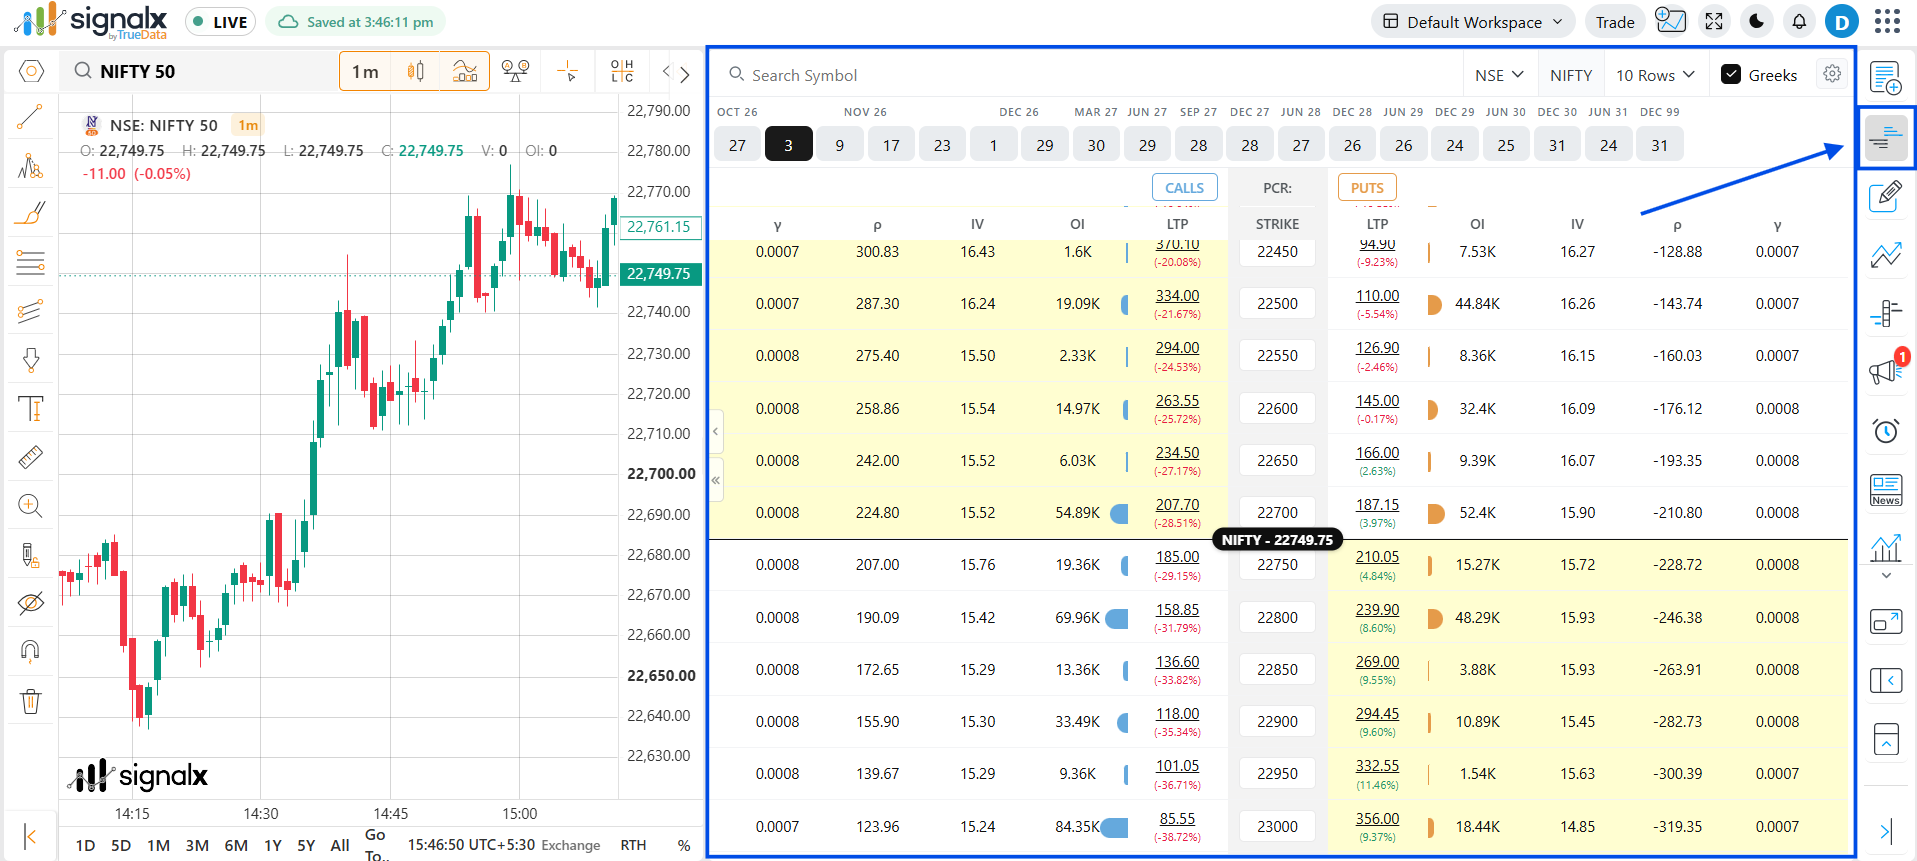
Strike-wise CE / PE Data
Each row shows one strike price. Call (CE) data on the left, Put (PE) data on the right, with OI, change in OI, LTP, IV, and volume for each side.
Expiry Selector
Switch between weekly and monthly expiries using the dropdown at the top of the panel. Near-expiry contracts update faster.
OI Bar Visualisation
Colour-coded OI bars make it visually obvious where the heaviest Call and Put open interest is concentrated - key support and resistance zones.
Max Pain Strike
The Max Pain level is calculated and highlighted automatically - the strike at which options sellers face the least combined loss at expiry.
PCR (Put Call Ratio)
PCR is displayed at the top of the panel. PCR > 1 indicates more Put writing - generally bullish. PCR < 0.7 signals caution.
Greeks Toggle
Enable the Greeks checkbox at the top of the panel to switch the CE/PE columns to Delta, Theta, Vega, Gamma, Rho, and IV for every strike.
Customisable Columns
Open the gear icon to choose exactly which columns show - Bid, Bid Qty, Ask, Ask Qty, Change, OI, POI, Volume, LTP, Timestamp, and every Greek - plus Display options like OI Bars, Real-Time updates, Lakh/Cr formatting, and Lot Size.
Full-Screen Overlay
The docked panel is a preview - for the complete strike ladder with expiry tabs and Greeks, use the overlay/expand button lower down in the right-side icon rail to open Option Chain full screen.
Watch for OI buildup at a specific strike during the session - strikes with the highest Call OI act as resistance, highest Put OI as support.
Strategy Builder
Options StrategyThe Strategy Builder sits alongside the Option Chain. Add legs straight from the chain with a single click, watch the payoff diagram and Greeks update live in the Strategy Basket, and read off Max Profit, Max Loss, and margin at the bottom - all without leaving the page.
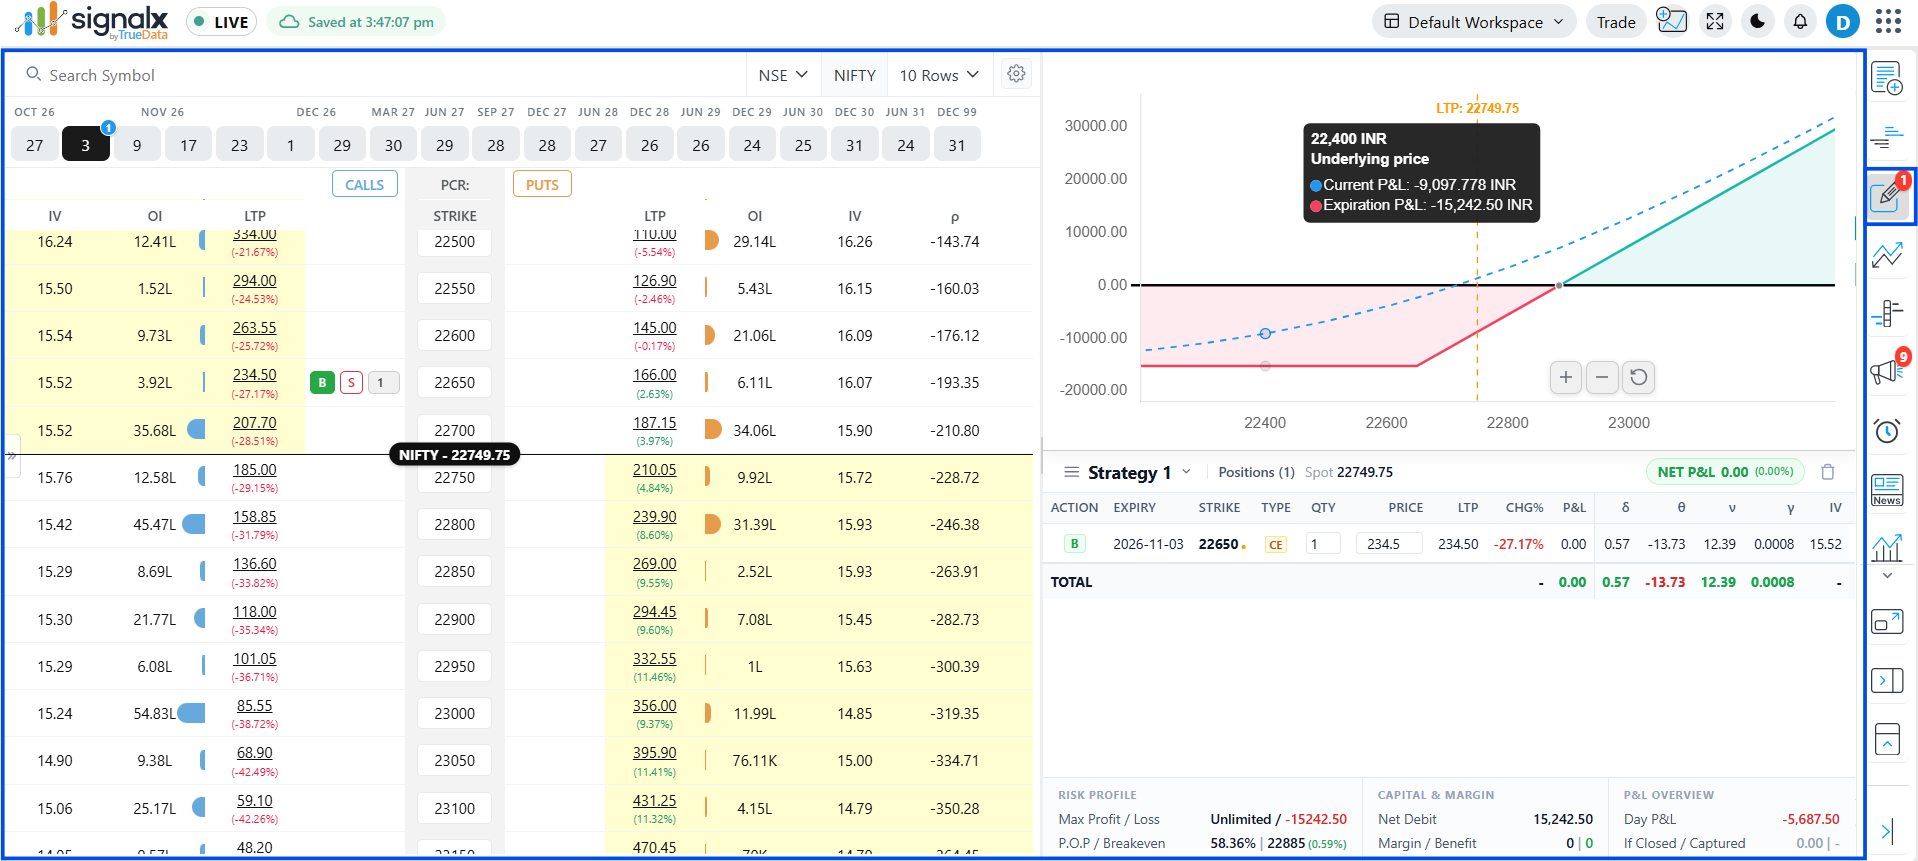
Build Directly from the Option Chain
Click the B or S button on any CE or PE row in the Option Chain to add that strike as a leg. The leg is added to the Strategy Basket instantly, no separate builder screen needed.
Strategy Basket
Every leg you add appears as a row with Action (B/S), Expiry, Strike, Type (CE/PE), Qty, and Price - plus per-leg Delta, Theta, Vega, Gamma, and IV.
Live Payoff Diagram
The P/L curve plots across a range of underlying prices, with the current LTP marked as a dashed line and the profit (green) and loss (red) zones shaded on either side of the breakeven.
Expiry Tabs
All available weekly and monthly expiries are listed as tabs above the chain. Switch expiries to add legs from a different series into the same strategy basket.
Editable Qty & Price
Adjust the quantity or price of any leg directly inside the basket - the payoff diagram and every summary stat below recalculate instantly.
Strategy Summary Stats
Underlying price, Max Profit, Max Loss, POP (probability of profit), Breakevens, Span Margin, Exposure, and Total Margin are all shown together at the bottom of the panel.
Add one leg at a time and watch the payoff diagram reshape after each addition - it's the fastest way to understand how each leg changes your breakeven and max loss.
Top Movers
Market PulseThe Top Movers panel on the right side shows real-time lists of the day's biggest gainers and losers across NSE and BSE. Use it to spot momentum stocks, unusual movers, and volume leaders without running a manual scan.
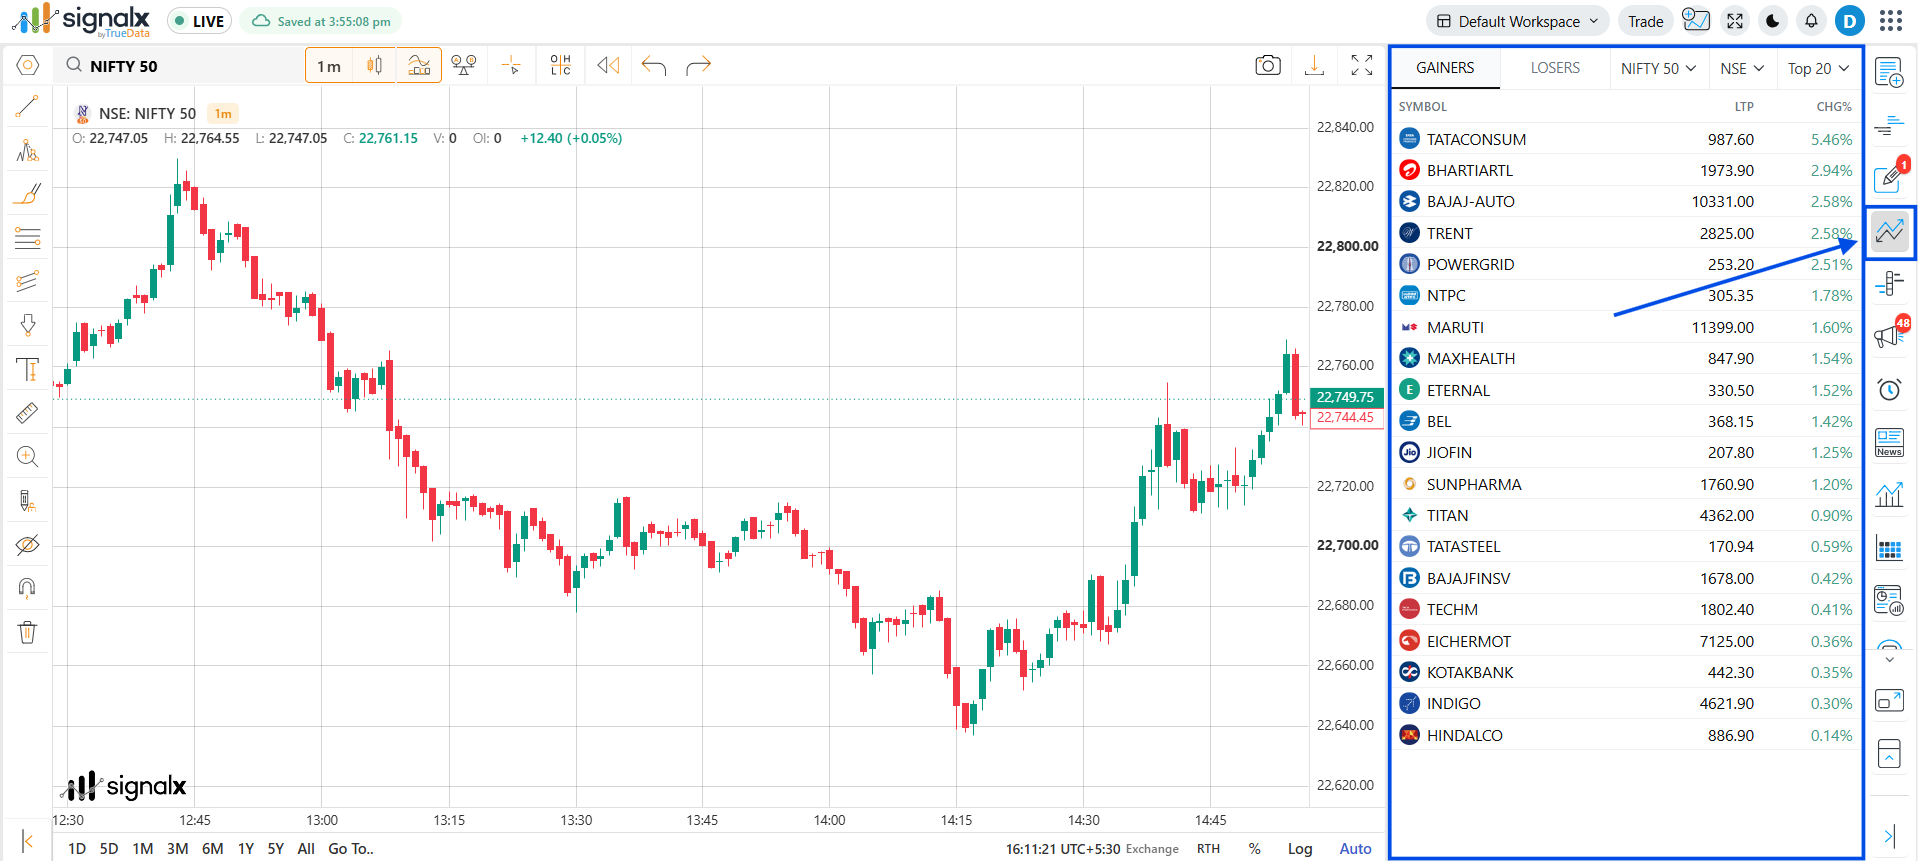
Top Gainers
Live ranked list of stocks with the highest percentage gain for the day. Updates tick-by-tick. Click any row to load that symbol's chart instantly.
Top Losers
Live ranked list of stocks with the steepest percentage decline for the day. Useful for spotting short candidates or oversold bounces.
Volume Leaders
Stocks with the highest traded volume today, regardless of direction. High volume with price movement confirms institutional participation.
52-Week Movers
Stocks hitting fresh 52-week highs or lows today. Breakout traders watch this list closely for momentum entries.
Segment Filter
Filter the movers list by segment - NSE Equity, BSE Equity, NSE F&O, or NIFTY 50 / NIFTY 500 constituents only.
One-click to Chart
Click any symbol in the movers list to load it directly onto the active chart panel. The current timeframe and drawings are preserved.
Check Top Gainers in the first 15 minutes after market open - stocks already up 2%+ on high volume in the opening candle often continue trending intraday.
Price Ladder ( DOM )
Market DepthThe Price Ladder (DOM) shows bid and ask quantities stacked against every price level, so you can read market depth right beside your chart. It is built for quick, readable order-book monitoring.
Easy to Open
Open the Price Ladder from the right-side menu, or from the chart's right-click menu, without leaving your chart.
Instant Bid / Ask
Bid and ask appear straight away, before the full market depth finishes loading, so you are never left looking at an empty ladder.
Flicker-Free Updates
The ladder doesn't flicker on every tick, so the price levels stay steady and easy to read even in fast markets.
Remembers Toolbar Settings
Your toolbar settings are saved automatically, so the ladder opens just the way you left it next time.
Ladder Columns
Each price level shows a Mini Chart, Bid, Price, Ask, and Volume, with the current price row highlighted in the middle of the ladder.
Live Info Strip
A strip at the bottom keeps LTP, Bid, Ask, Tick size, and Lot size in view at all times.
Keep the Price Ladder docked next to your chart - watching bid and ask quantities build up around the current price gives you context that candles alone can't.
Corporate Announcements
Corporate EventsThe Announcements panel aggregates live corporate filings, exchange notices, and regulatory announcements directly from NSE and BSE. Stay informed of board meetings, results dates, dividends, splits, and bonus announcements without leaving SignalX.
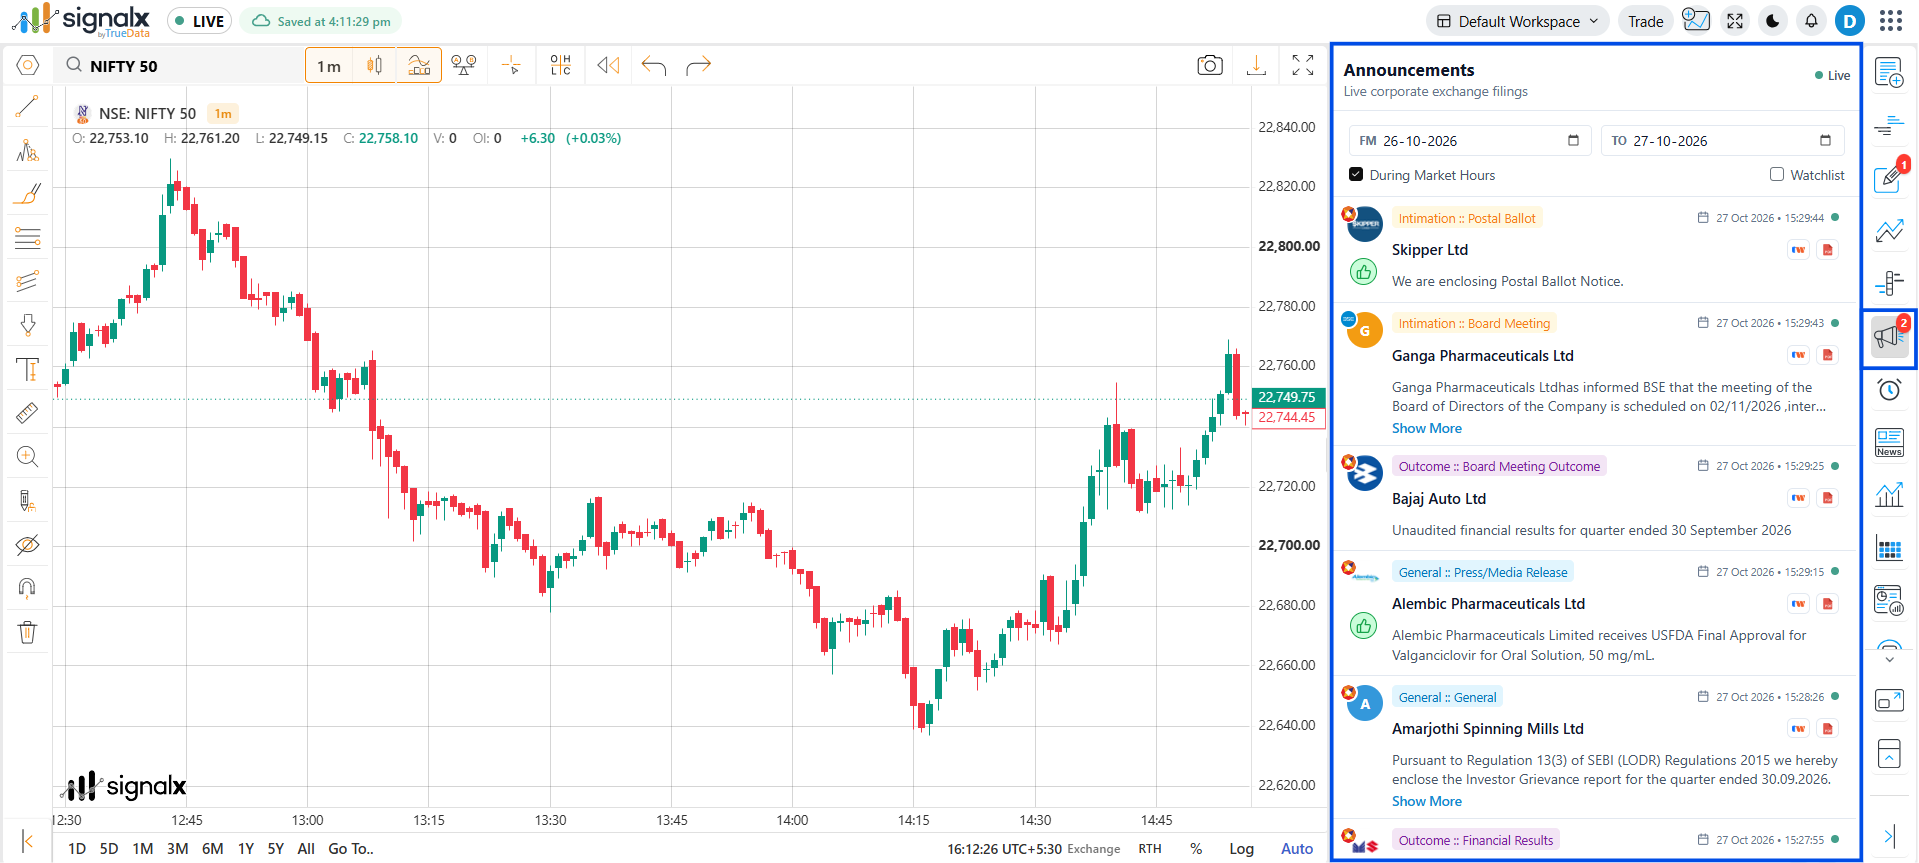
Live Exchange Filings
BSE and NSE announcements stream in real time as companies submit filings. Each entry shows the company name, subject, and timestamp.
Results Calendar
Quarterly and annual earnings result dates for all listed companies. Filter by date range to see what's due this week or this month.
Dividend Announcements
Board-approved dividend records including dividend amount per share, record date, and ex-dividend date.
Splits & Bonus Issues
Stock split ratios and bonus share issuance announcements with ex-date and record date highlighted.
Board Meeting Notices
Upcoming board meeting dates with agenda items - particularly useful for tracking companies likely to announce dividends or results.
Filter by Category
Filter announcements by type: Results, Dividends, Board Meetings, AGM/EGM, Mergers, Bonus, Splits, or Regulatory filings.
Enable notifications for specific stocks in the Announcements panel - SignalX will alert you the moment a new filing is submitted for that company.
Market News
News FeedThe Market News panel streams live financial news headlines directly into SignalX as they're published, so you can catch what's moving the market without switching tabs.
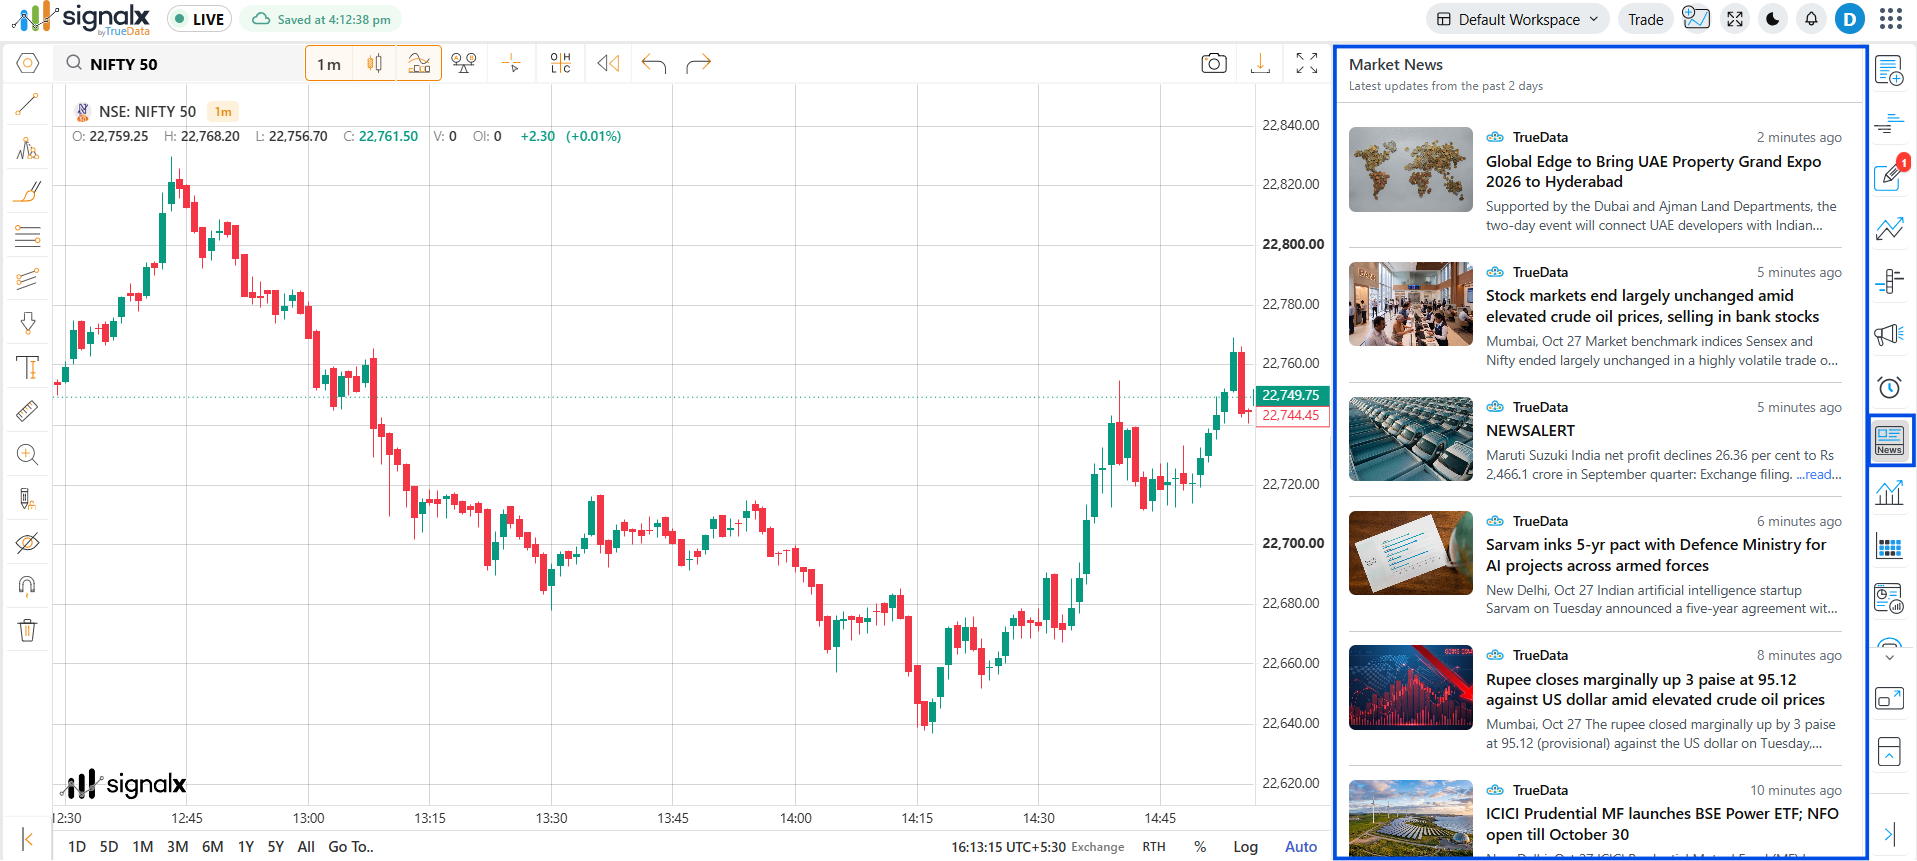
Live News Feed
Headlines stream in continuously throughout the trading session, in the order they're published - no refresh needed.
Source Link on Every Headline
Each news item carries a link to the original source, so you can open the full article on the publisher's site with one click.
Pair Market News with the Heat Map - a red sector alongside a cluster of negative headlines is usually the fastest way to confirm what's driving the move.
TS Window ( Tick By Tick Data )
Order FlowThe TS (Time & Sales) Window tracks the symbol currently loaded on your active chart and streams every executed trade for it as a live, tick-by-tick log - side, size, price, and time - giving you a raw view of order flow beneath the price action.
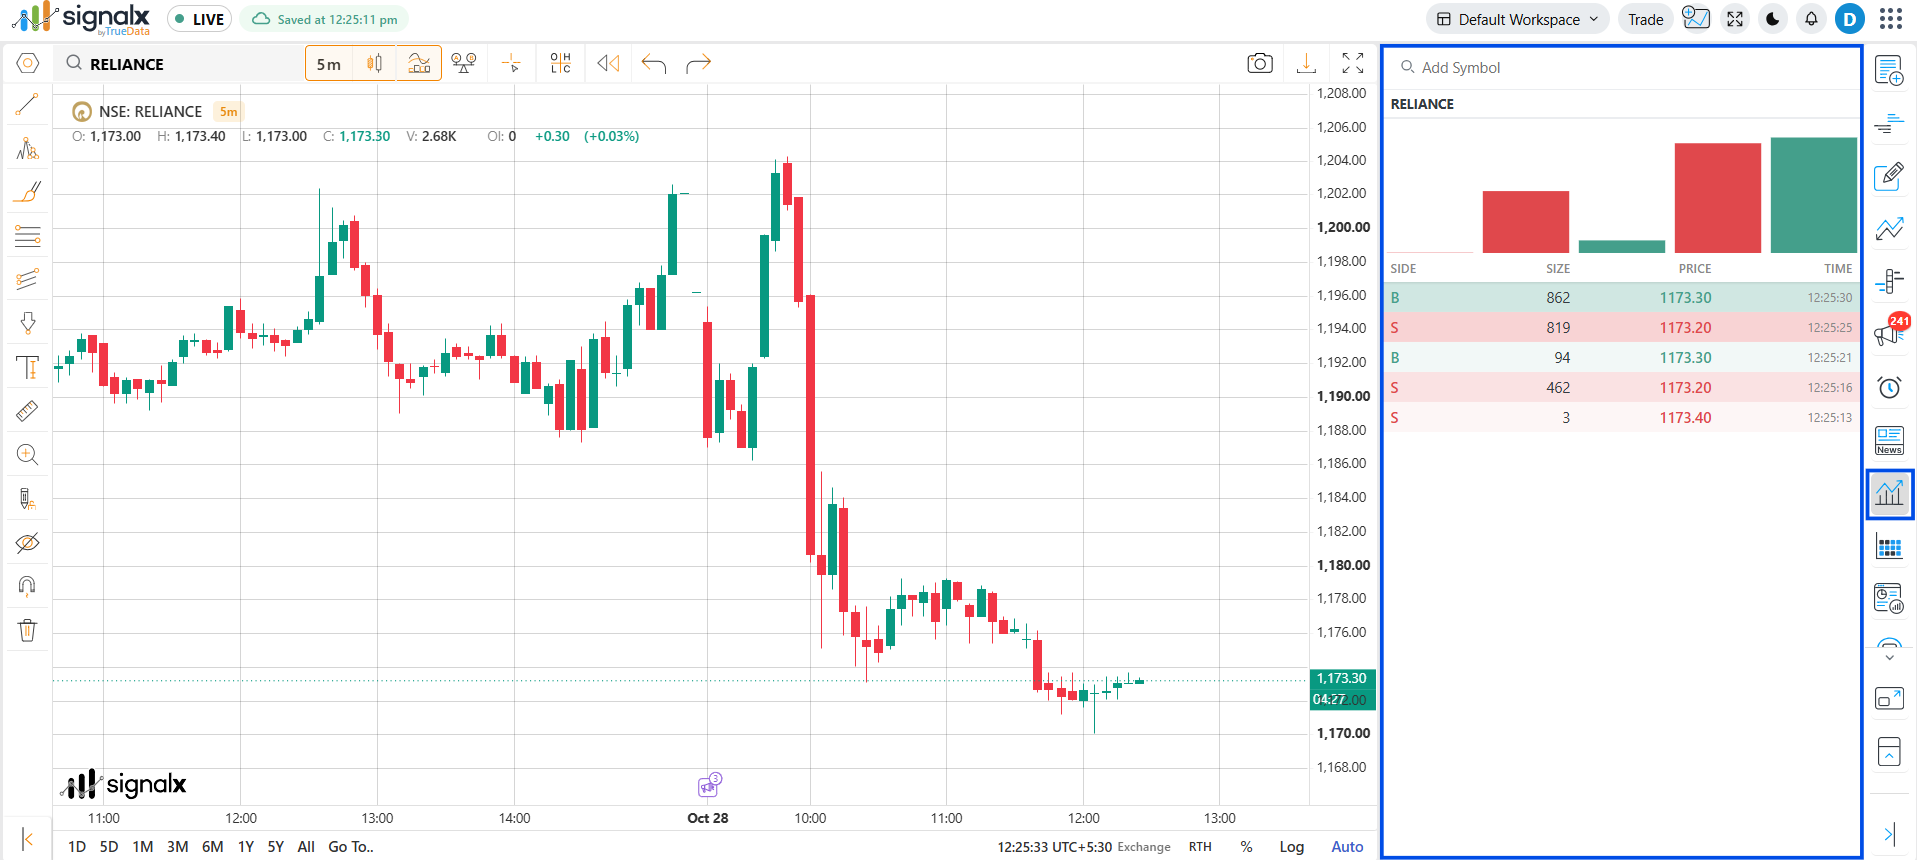
Follows the Active Chart Symbol
The TS Window automatically tracks whatever symbol is loaded on your working chart - switch the chart symbol and the tick log switches with it. Use the search bar at the top to look up and pin a different symbol independently if needed.
Tick-by-Tick Trade Log
Every executed trade streams in as a new row with four columns - Side, Size, Price, and Time - in the exact order it happened, down to the second.
Buy / Sell Colour Coding
Each trade is tagged B or S. Buy-side trades print in green, sell-side trades print in red, so you can read aggression at a glance without checking the price column.
Trade Size Histogram
A live bar chart above the log plots the size of recent trades, colour-coded by side, so unusually large prints stand out visually before you even scan the table.
Large Trade Highlighting
Trades that are significantly larger than the surrounding size get their entire row highlighted, making block and bulk deals impossible to miss as they print.
Precise Timestamps
Each row carries an hour:minute:second timestamp, so you can line up prints exactly against a chart pattern or a news headline.
Watch the size histogram, not just the table - a sudden tall bar usually means a large print just went through, worth checking the highlighted row for the exact size and side.
Heatmap
Market OverviewThe Heatmap panel gives you a visual overview of the entire market at a glance. Each stock is represented as a colour-coded block - green for gainers, red for losers - sized by market cap. Spot sector rotations and broad market sentiment in seconds.
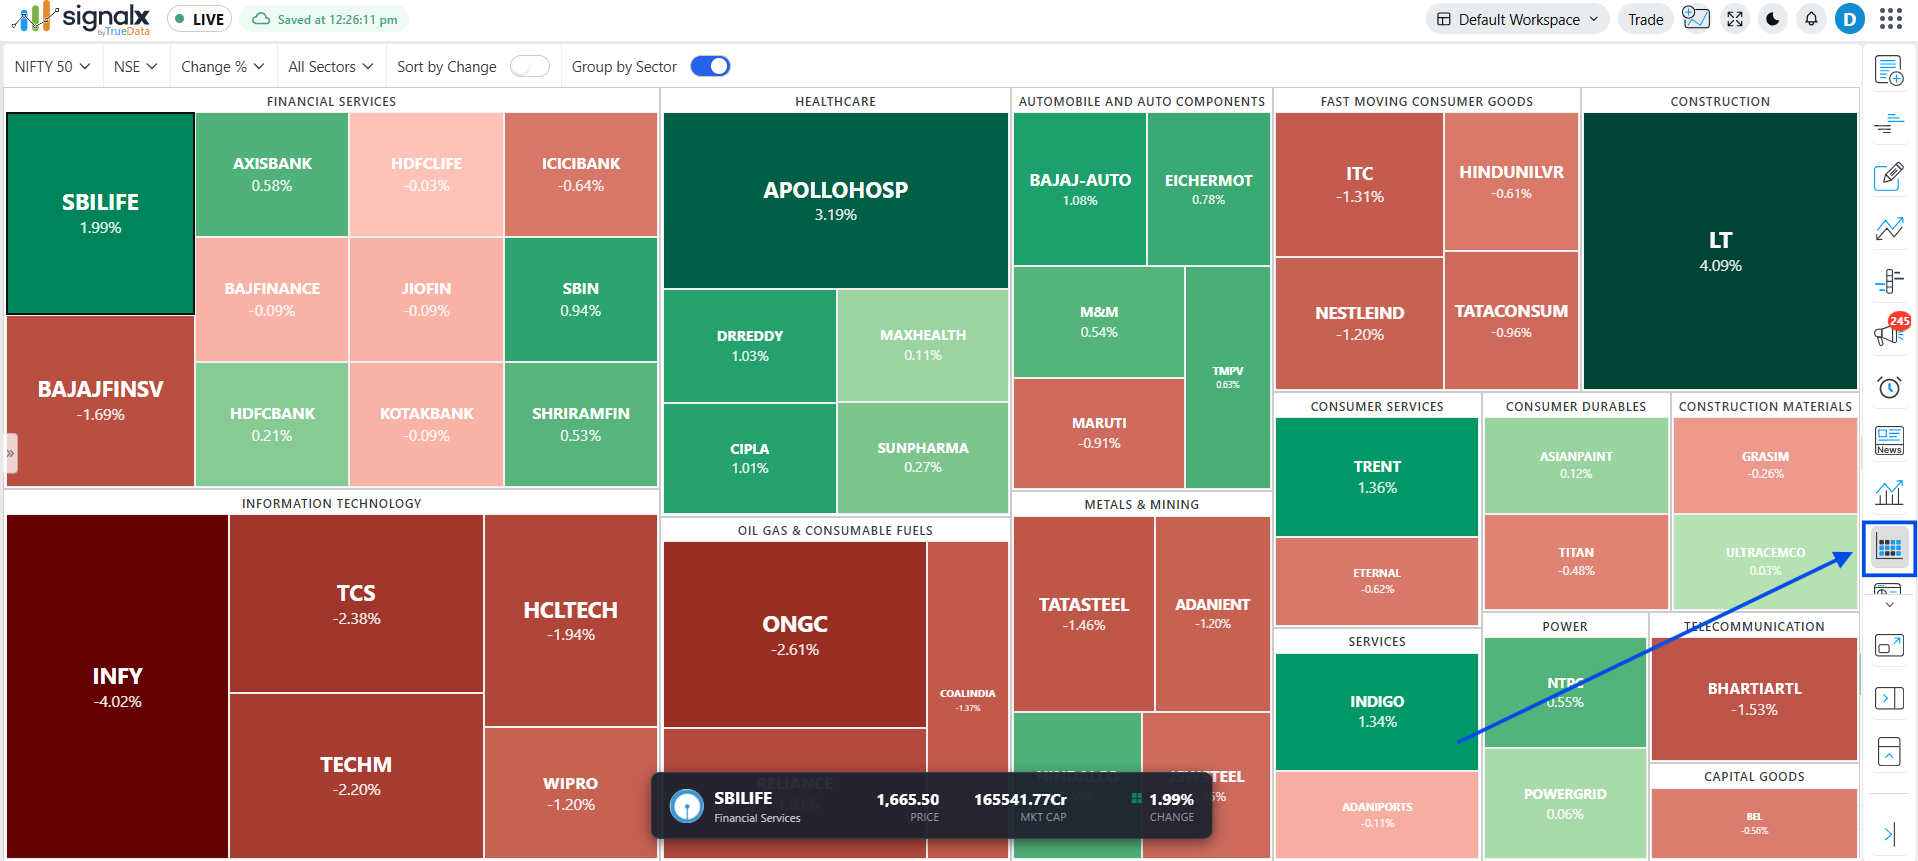
Market Cap Sizing
Each block's size represents the company's market capitalisation. Larger companies like Reliance, TCS, and HDFC Bank occupy more visual space.
Colour Coding
Deep green = strong gainer (>2%). Light green = mild gainer. Light red = mild decline. Deep red = strong loser. Intensity scales with percentage change.
Sector Grouping
Stocks are grouped by sector - IT, Banking, Auto, Pharma, Energy, FMCG, and more. Identify which sectors are leading or lagging the market today.
Index Filter
Switch the heatmap between NIFTY 50, NIFTY 500, NIFTY Bank, NIFTY IT, or the full NSE universe.
Click to Load Chart
Click any block in the heatmap to instantly load that stock's chart in the main chart area.
Hover for Details
Hover over any block to see the stock's name, LTP, change %, volume, and sector without navigating away from the heatmap.
If the heatmap shows a single sector entirely red while others are green, that's a sector-specific event - check the Announcements panel for related news.
Scripting Panel
AutomationThe Scripting Panel lets you build custom indicators and automations using TD Scripting - SignalX's JavaScript-based scripting engine. Write scripts that react to live ticks, plot custom studies on the chart, and pull historical or option chain data on demand.
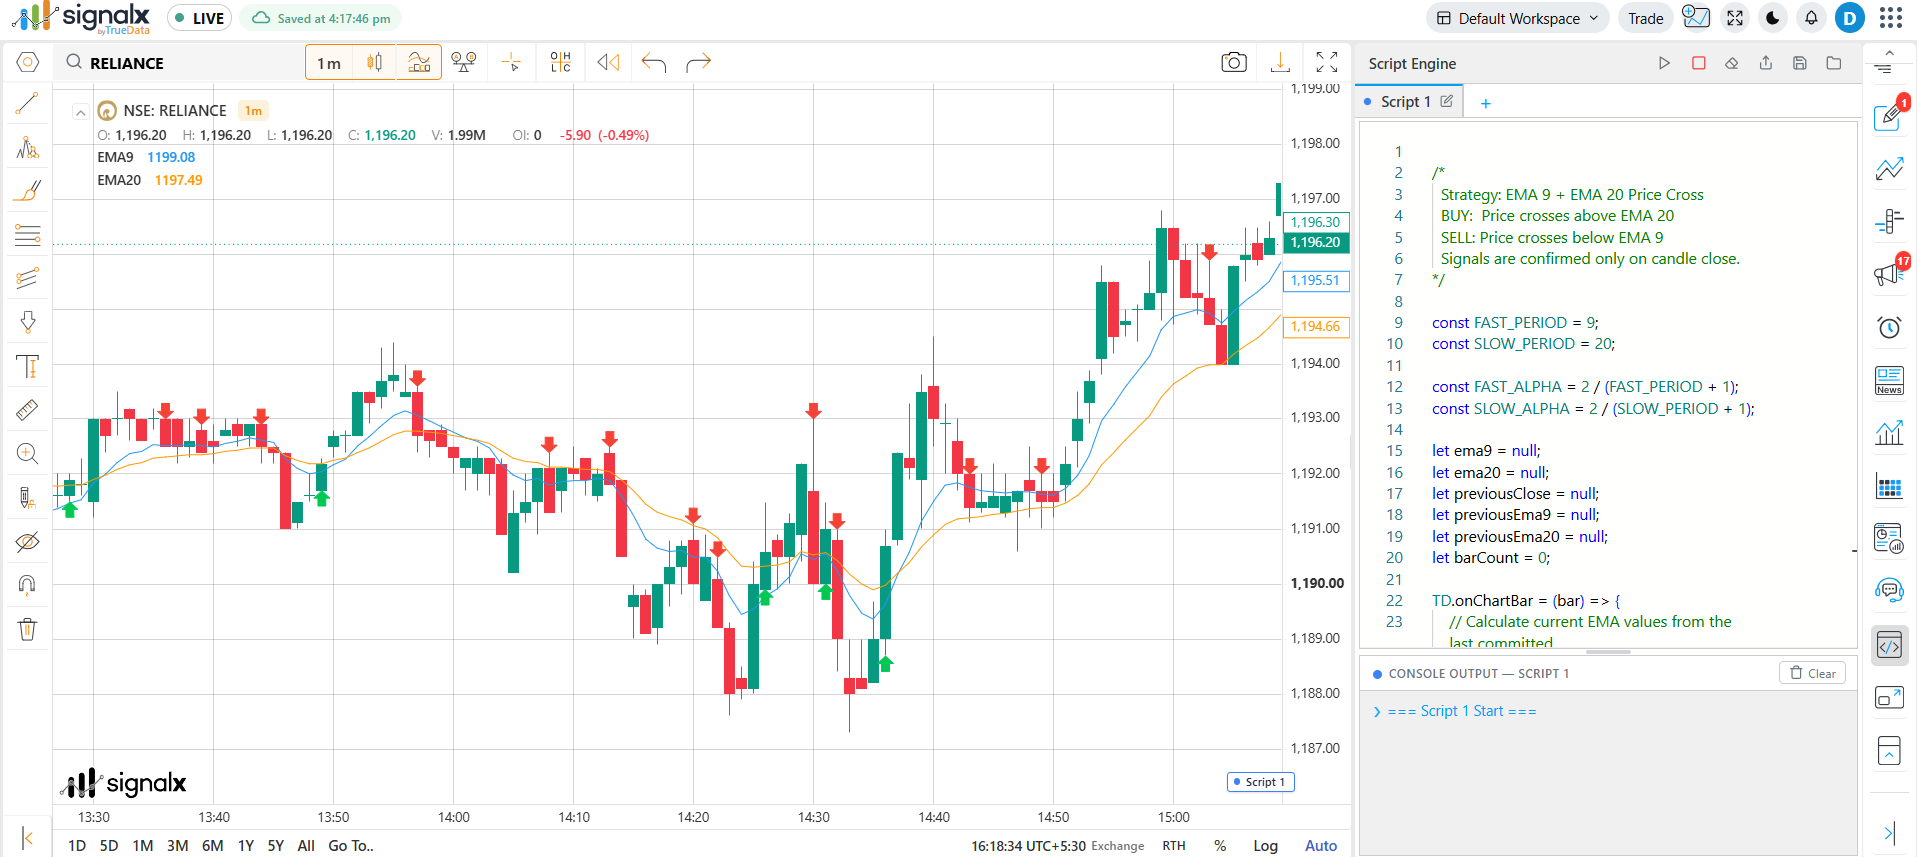
Script Editor
A full code editor for writing TD scripts directly in the browser. Syntax highlighting and inline error markers help you catch mistakes before running.
Start / Stop Controls
Run your script with a single click. TD.onStart fires immediately, and TD.onStop cleans up subscriptions the moment you stop it.
Console Output
Every TD.log() call streams into the built-in console, so you can watch live tick data, debug values, and error messages as your script runs.
Script Library
Save, rename, and organise multiple scripts. Reopen any saved script instantly without losing your work between sessions.
Chart Plotting
Use TD.onChartBar with TD.Chart.plot to draw custom lines, markers, and shapes directly onto the active chart as a live indicator.
Sandboxed Execution
Scripts run inside a secure Web Worker with direct browser APIs disabled. All platform access goes through the global TD object.
New to TD Scripting? Start from the Custom Moving Average or Historical Bars examples in the Scripting Reference Guide and modify them to fit your own strategy.