Heat Map
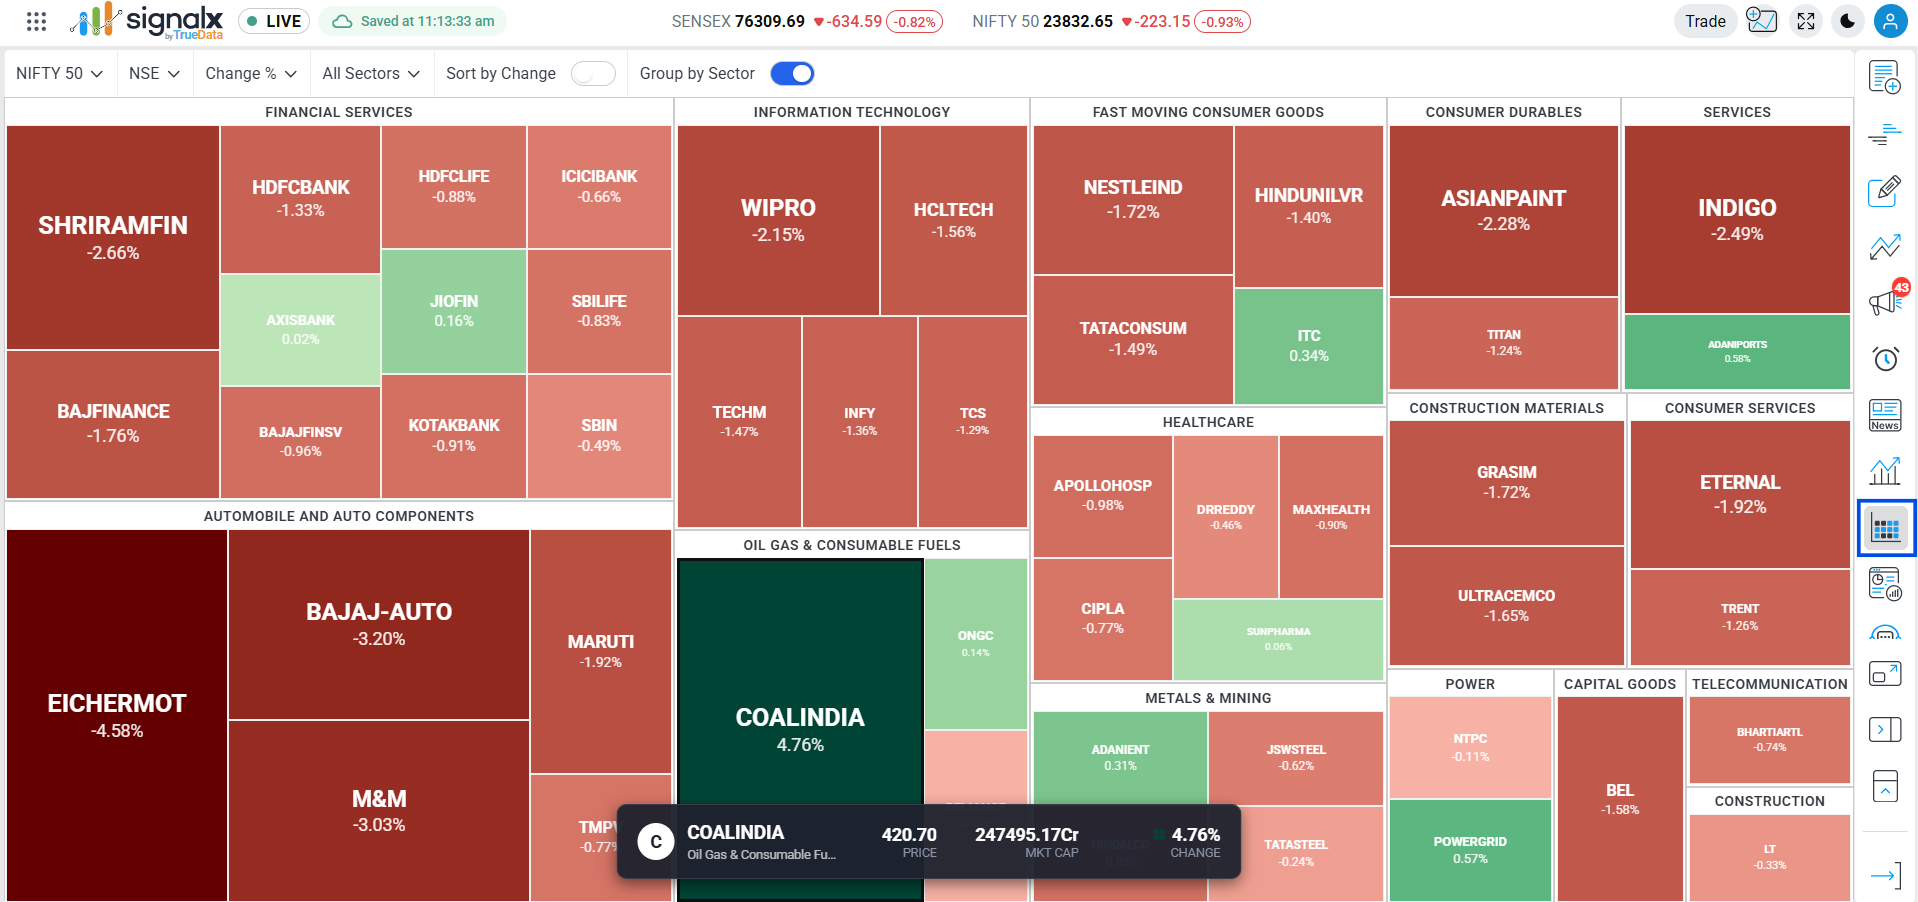
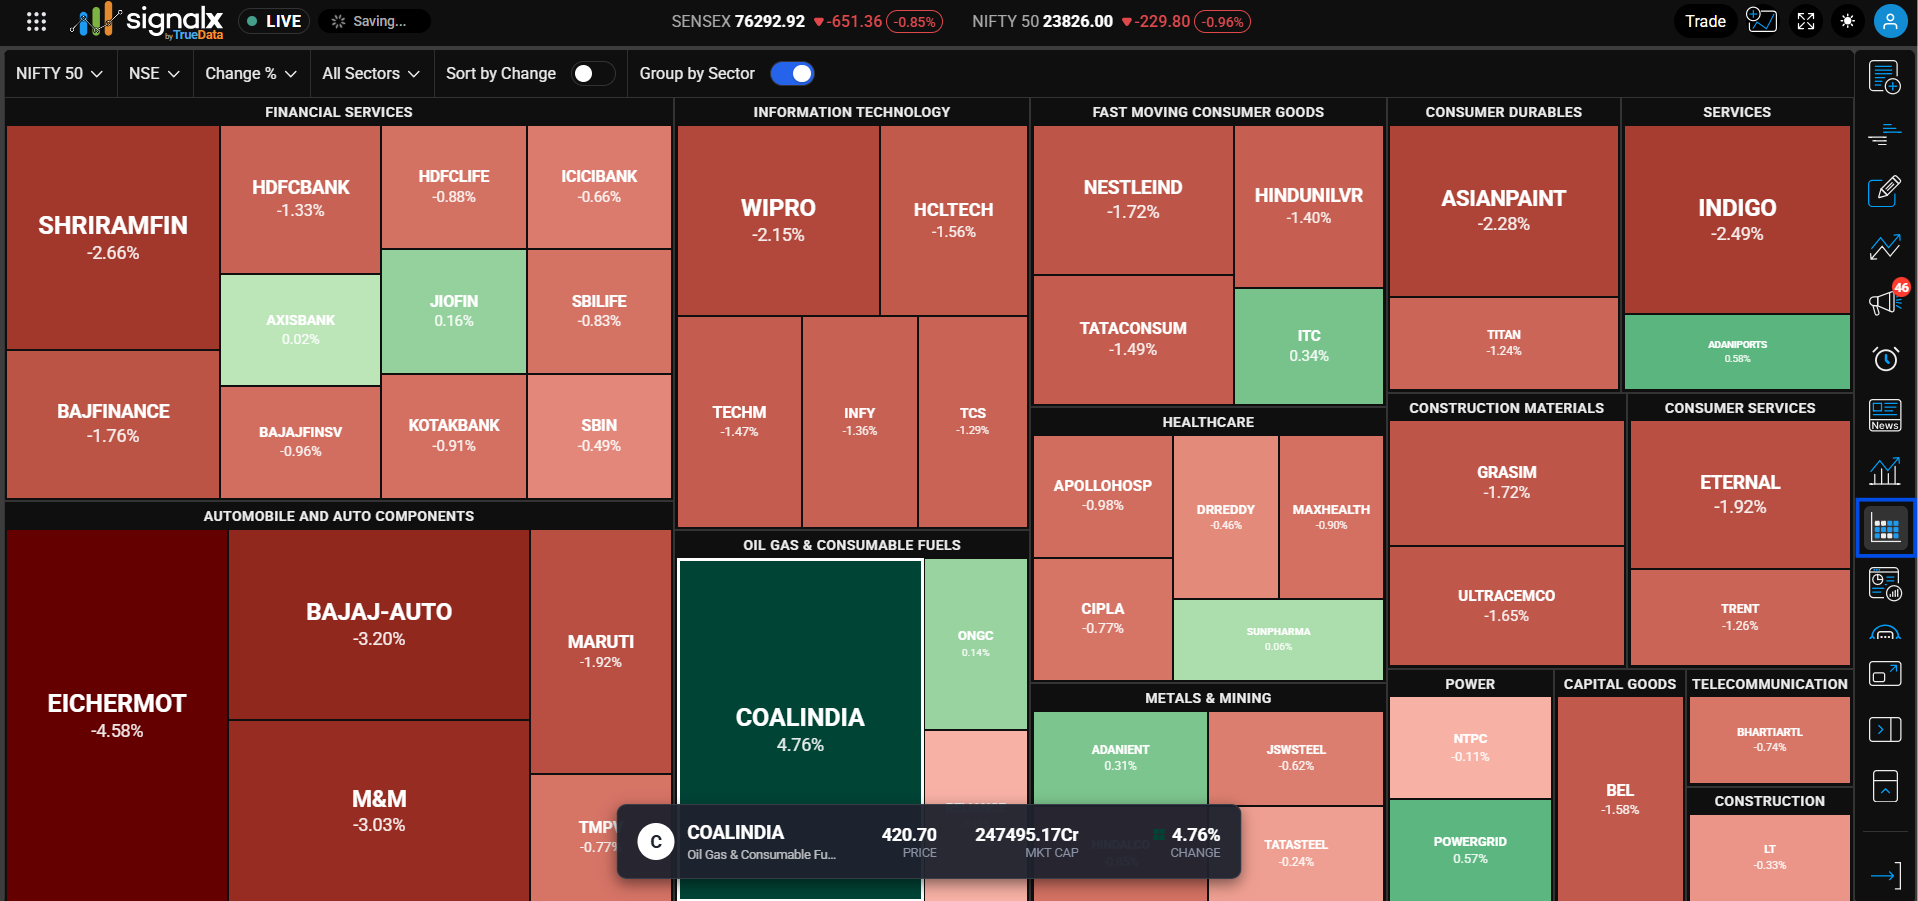
Instantly visualize market sentiment using a color-coded, sector-grouped treemap. Green tiles indicate gains, red tiles indicate losses, and tile size represents the selected metric's relative weight.
Quick Walkthrough
Open Heat Map
Click the Heat Map icon in the right-hand toolbar. It opens as a half-panel alongside your chart by default.
Expand to Full Screen
Use the Overlay Panel toggle to expand the heat map to a full-screen view for a more detailed look at every tile.
Set Your Filters
Pick the Index, Exchange, Metric, and Sector from the dropdowns at the top to shape exactly what's on screen.
Click a Tile
Click any stock tile to instantly load that stock on the main chart canvas.
Filters and Controls
Six controls sit in the top bar of the heat map, all updating the treemap instantly
Index Selector
Choose the index universe to display: NIFTY 50, NIFTY BANK, NIFTY NEXT 50, NIFTY 100, NIFTY MIDCAP 50, NIFTY SMLCAP 50, NIFTY 200, NIFTY 500, NIFTY AUTO, and more, scrollable in the dropdown. Default is NIFTY 50.
Exchange Selector
Filters the data by stock exchange. Default is set to NSE.
Metric Selector
Determines both the tile color basis and the value shown on each tile. Options: Change %, Market Cap, Turnover, Volume, Equal Weight. Default is Change %.
Sector Filter
View all sectors or narrow to one: Automobile and Auto Components, Capital Goods, Construction, Construction Materials, Consumer Durables, Consumer Services, Fast Moving Consumer Goods, Financial Services, and more. Default is All Sectors.
Sort by Change (Toggle)
When enabled, sorts individual stock tiles within their respective groups by the magnitude of percentage change.
Group by Sector (Toggle)
When enabled (default), visually clusters individual stocks into their industry categories, e.g. Financial Services, Information Technology, Healthcare.
Visual Layout and Data Display
How the treemap organizes and labels each stock
Sector Groupings
When Group by Sector is on, stocks are organized into labeled blocks such as Financial Services, Information Technology, Healthcare, Metals & Mining, Automobile and Auto Components, Fast Moving Consumer Goods, and more.
Stock Tiles
Each rectangular tile within a sector block represents an individual stock.
Tile Information
Inside each tile, the platform displays the stock symbol (e.g. COALINDIA) and the value for the selected metric (e.g. 4.76% when Change % is active).
Tile Sizing
Tile size is driven by the selected Metric - e.g. larger tiles mean higher Market Cap, higher Turnover, or higher Volume, depending on which metric is active.
Colour Scale Guide
Understand market movement intensity
The intensity of the color directly corresponds to the magnitude of the selected metric. The higher the absolute value of change, the darker and more intense the shade of green or red. Switching the Metric dropdown to Market Cap, Turnover, or Volume changes what drives tile size, while color still reflects price movement.